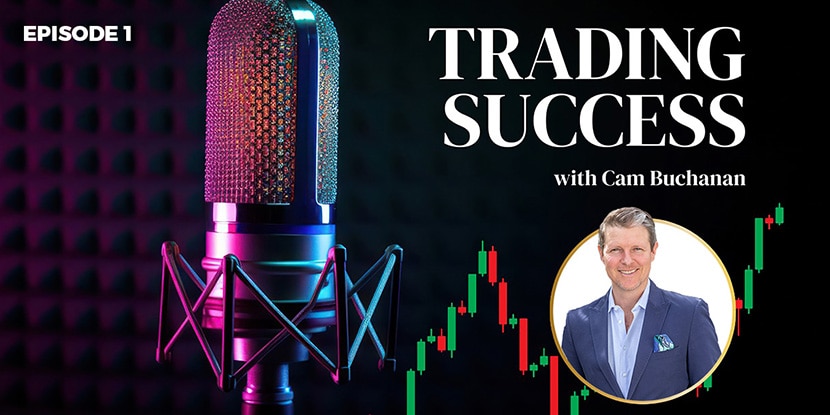
Welcome to Trading Success With Cam Buchanan and Chris Broadfoot – Episode 1
Join Cam and Chris as they discuss the upcoming FOMC announcement and how that impacts the markets, and our trading decisions.
Transcript
Chris: Good morning, everyone, and welcome to Trading Success, with Cam Buchanan, founder of The International Day Trading Academy. Welcome to Episode One, Cameron.
Cam: Good morning. How are you? Good. Thank you, Chris. Thank you for having me. Hope you had a wonderful weekend.
Chris: Yeah, definitely, definitely looking forward to getting this underway. I know it’s been a long term project for you guys it’s, great to kick it off.
Cam: Yeah, it’s gonna be fun looking forward to it. There’s, there’s so much that happens in the markets. And it’s great to inform people of what’s happening and how to be ready and prepared for the best opportunities in the markets. So it’s good to be able to share this information.
Chris: I’ll get you to start with a bit of an introduction because I know that your background is as a trader, and also an educator. So you’re gonna give people a bit of an overview of who you are what you do, that’d be awesome.
Cam: Absolutely. My name is Cameron Buchanan, or Cam Buchanan, I’m the founder of IDTA. I’ve been teaching people -just everyday normal mums and dads, how to trade the futures markets, been doing that for over 11 years now. And this is, a great industry, it’s very new in Australia, not many futures traders in Australia, I think, based on statistics, I think there’s only around about 4000, futures traders that have accounts that trade into the Chicago Mercantile Exchange, which is the largest futures exchange in the world.
And it’s only been through the advantage of faster internet connections, better trading platforms, obviously, technology has made it more accessible for people to be able to access these futures markets from anywhere in the world. So they’re open to all types of traders, professional traders, institutional traders, and then also your private and retail traders or, you know, mums, and dads as the industry would call it. So it’s open to a whole wide range of people with different interests and types of trading styles.
So it’s highly competitive. And you really need to know what you’re doing. Dealing in the futures markets is considered a high risk product, in terms of, if you’re doing a statement advice in the financial planning world, if you did a a an SOA, which they call it on futures trading, it would come up as high risk. Whereas if you were putting money into say, a cash account or a bank account, it would be deemed as low risk. So that’s kind of where we’re trading sits in it.
So basically, you need to be educated, you need to be prepared, and it takes training on the skills involved. So yeah, that’s what we’ve developed over the last 11 years is how we can make our traders better traders, more confident in what they do. And it’s in trading, you do have to overcome some of the what we call the humaneness, the ego. Sort of almost normal human behavior, which has been tested scientifically that humans, the natural human condition has these behaviors, so you have to be very mindful of those behaviors, because they can be quite damaging as a trader and an investor. And a lot of people are so not aware of these types of behaviors.
We probably don’t have time to go through all that in this episode. But we can go through that later on as we go along. But for today, really what I want to share with everyone is, is what’s happening in the markets, because there’s some exciting news announcements that can affect the overall general direction in the markets. And it’s good to be prepared and have some have some signals and some signs in the markets to look for particular opportunities. So that’s what I want to share with you guys today is, is being prepared in terms of your trading plan. So that the, the the emotional stuff isn’t as as overpowering.
Chris: Definitely, as you said, we will touch on episodes because we could go on for days, but I want to be able to talk about the trading psychology being 80 to 90% of a successful trader, you know, so it is very important that as you say won’t open that can of worms today because I could go on forever. But yeah, so talking about this week in general, we know that the FOMC announced having an interest rate decision. So yeah, if you want to give us a bit of an overview on your thoughts around that for this week, and what that will mean for the markets in general.
Cam: yeah, that is true. So Thursday morning, Queensland time, 4am In Queensland, if you’re in New South Wales, Victoria, it’s 5am still.
“FOMC” So what that means is, it’s where the Federal Open Market Committee, basically the Federal Reserve, the Central Bankers in America, that speak to the media, they give a press conference and a statement on where they think interest rates are going in the near future. So last year, end of last year, the FOMC announced that they’re going to start cutting interest rates in 2024, They were talking about potentially three cuts. Since that time, the market has just skyrocketed. We’ve seen the, the US stock markets just absolutely have a huge rally.
At the start of the year, they’ve been a little bit like, okay, we’re still not ready to cut just yet, we’re just going to keep following the key indicators. And the key indicators they look at is CPI, which is Consumer Price Index, PPI, which is the Producer Price Index. So how much it costs for Manufacturers and Producers to create their goods. Employment is also another factor they look at as well. They’re the probably the three main indicators.
So we had three of those news announcements come out last week. That was a bit of an indicator, or leading, as to what Jerome Powell, who’s the Chairman, will discuss this Thursday. And we’ll go into the charts, and we’ll show you some of the reactions from some of those news announcements that came on last week. But we can look in the charts. And we can see, the charts can give us early warning signs as to what the market is likely going to do. So we can be on the front foot be prepared, we can mark up our particular price levels, which we need to see the market do certain things around those price levels or price zones. That will give us more confidence to make our particular trades.
So basically, last week news, how the news came out was CPI was flat. And and I can show you in the charts, what happened on that particular day. And I’ll use my I use my 30 minute chart. I’ll just share this screen to show you.
So this was the this was the CPI news that came out last week. So you can see that’s when the news came out on that particular day. So quite often, when you have major, what we call “Red Flag News”. There’s it has an impact on the market, and you get a huge amount of price movement. Eventually the market works out the direction it wants to go. So initially, what happened, the market spiked up and then it spiked down. Then on the open of the US market. So this was the opening 30 minute period, the market spiked down, and then the market rallied. The CPI news was fairly flat, like inflation hadn’t increased, which was the World Consumer Price Index hadn’t increased, which was fairly fairly bullish for the market.
Now on Thursday, it kind of flipped around. So Thursday, news came out with PPI which is the Producer Price Index, and that was fairly negative. So it basically the core CPI, which is the core CPI number came out at sorry, then the main PPI number producer price index. That was the change. So basically, that’s the change in price of goods by producers. So that was up by point 3%. So their cost of producing obviously had increased. And obviously, they factored that into the price. So the market didn’t like that, and the market sold off and then it kind of just dribble down during the day.
Then on Friday, the market sold sold down. And the market finished fairly bearish coming into the weekend. So this week is going to be big because there’s been a bit of mixed mixed information. Employment was fairly strong last last week as well. They announced employment on Friday. So the employment numbers were quite good but the CPI was fairly flat, but the PPI had increased. So that’s kind of maybe a fairly bearish sign. So it’ll be interesting to see how the FOMC take into account those numbers to come up with what they’re going to say.
So a lot of traders watch that FOMC meeting like a hawk, they will they wait for the announcement to come out. And they really listen intently on the words of what is said. And that’s probably most important thing. The they can be very cryptic in what they say a lot of these speakers, these federal chairman, representatives, they’re not 100% clear, they don’t really give 100% information, they sit on the fence a lot of time, but sometimes they will allude to what’s likely going to happen. And when they do make a decision, and really clear decision, we see the market react. So for instance, last year, we’ve seen the market react massively. So for instance, you can see, last year, this is where they started talking about interest rates being cut in next year, and the market just rally amazingly.
So this is kind of where we’re sitting right now we’re up at all time highs. And now the markets got to this point where we’ve basically been moving up in, in this, we’re in this second, very large, what I call an impulsive wave, right here, right now. And we’re right up to a key Fibonacci extension level as well. So this is gearing up for a potential, whether we’re going to see a slight pullback. If anyone knows anything about Elliot wave, we’re in the third wave. And typically, within this third wave, you will have three or five waves within within this section. So we’re in wave five of wave three of a larger wave three. So what we saw last week is very important.
So this is a daily chart. Alright, and what the daily chart is showing us is is this was Friday, so Friday finally broke out of what we call this balance zone. So we had, if we look at this particular candle here, you can see the market was balanced within that for pretty much the last two weeks, a market had been just bouncing up and down in that period, the market extended a little bit higher fall, and then late last Friday, we actually closed outside that range.
So for me, that’s a fairly bearish sign that that that’s occurred, we had three red candles as well, which is can be typically a bearish sign. You can see here, when was the last time we had three red candles, the market sort of sold off for a little bit. So we’ve had three red candles in a row. I don’t think we’re going to have a huge correction. But we may have somewhat of a correction this week, if Jerome Powell comes out and says he’s not happy with where the economy’s going and he’s not prepared to cut interest rates, then that could dampen the spirits of investors and traders and they could get out of the stock market and go into probably more safer assets like government bonds and those sorts of things. So that’s another interesting market to watch as well as the interest rate market.
The CME does have an interest rate market now, which is been around for a little while, but that’s starting to gain a bit more traction. That’s another way that traders can access the markets, we’ll talk about that in another podcast is looking at interest rates, or trading interest rates and how you can trade interest rates. But it’s, it’s for most people, it’s a fairly easy thing to understand interest rates either go up or go down. And you can actually trade those moves. So you know, if they’re going to keep these rates up at these high levels, that means that obviously, interest rates are going to stay up and that can be an opportunity for people that make money in the interest rate market. And therefore the stock markets get affected by that because really how how you make money in the financial markets, longer term is following the capital flows following the the way that money is going.
As we can see, at the moment, a lot of money is going into tech, like AI has been huge, like AI is on everyone’s lips right now. So all the companies that are heavily involved in AI are just surging, you know, like Nvidia for instance, I made mention of Nvidia at our annual conference in November, it was around $400 at the time that’s basically doubled. That’s only been, you know, four or five months that that market has doubled in its price. So it’s that insane type of appreciation. Right? So this is the kind of stuff that’s driving markets right now is is this new technologies, the the positivity around interest rates coming down. And, and, you know, the economy is generally strong overall, the only thing that, as traders, we have to look at is just we want to take advantage of fluctuations in the market that occur. So the market, if it’s been in a bull run, at some point, there’s going to be a bit of a sell off, and generally news, negative news can spur that on and we can see that occurring in happening in the charts as well.
Chris: About the comment about, you know, being prepared, because it is that there has been red flag news, or market news that can be the catalyst for these things. So being aware of it and planning for it ahead of time, because obviously, there’s a day trading, volatility, that’s, you know, where you can absolutely take advantage of things. So the preparation is key.
Cam: Yeah, and there’s things you can see in the charts that give you those types of indicators, you want to see how markets react around price zones, we call it support and resistance zones in the market. So I’ll give you an example. So for instance, this is, so this is a 30 minute chart. And this is what we’ve seen recently. So this is since the 22nd of February. So this is basically a month’s worth of trading action. So you can see, this is where the volume, this particular indicator, here is what I call a volume profile, and what it shows you is volume at price, volume is a very powerful indicator, we can measure volume through time as well. So down the bottom here, you can see all of these volume bars here. They’re just calculating volume at time. So each and every time period.
So this is a 30 minute chart. So each one of these bars is volume, per 30 minute candle or 30 minute bar. So whereas this is at price, so it’s looking at all of the volume, and where’s the volume accumulating. So we can see here that this I’ll make this a bit shorter. So you can focus more on what’s happening. You can see here at that particular price, which is around 18266, this is the NASDAQ market by the way, which is the market majority of our traders trade because of because of the because of the volatility in this market, it’s an has a nice amount of volatility. Also, we have other traders that trade the S&P 500 or the ES the E Mini S&P 500 futures contract, they’re the two most popular contracts.
So the NASDAQ and the S&P they do move very similar but highly correlated markets. So you can see where the market has predominantly been accumulating. And this is this is basically what they call the point of control. So this is the most traded price. So up here, this is the all time high up at 18600 at around that zone there. So that’s would be considered resistance in the market. And we’ve been up there twice, and we’ve failed. And now the market has come back to the point of control from this most recent swing from the low down here. And the market on Friday traded down below that area. So it broke under where I’ve got all these arrows, you can see this is where we could see institutional buying coming in and driving prices higher.
It’s important to know where the institutions are coming in, because as a retail trader, we cannot move the market were too small. We need the bigger players to come in and drive markets and we just basically take advantage of their movement, they’re moving the price will jump on and join with that momentum. Now, basically, institutions have come in here 12345 They tried to come in here, the sixth time over here, and they got stuck here, strong redirection, and it got stuck pretty much at the top of this profile. Okay, so this is basically telling us where this darkened section of the profile, basically telling us where 70% or 68% of the total volume that’s been traded. has been concentrated in this area. So this sign here, the market sold off that level, that’s an early warning sign that maybe the buyers have given up, and then they may be getting out of the market. This hasn’t been such a bullish move, and then pulling out and now that we’ve broken, or went back into this, this bind zone here, where they where they really start to lift off from, this is where we see where we’re trading right now.
And this is the obviously Monday morning, this is the the opening 30 minute period. Now that was the first 30 minute period today. So this is a very key zone for traders to watch that channel move out today. 18,000 is a very key number here. So we’d be looking for the market to hold under that level for shorting opportunities. And if the market does want to sell off this, there’s really nothing in the way, there’s, you can see down the bottom here, this was the last time buyers started to come in. So if the market does sell off this week, market will probably be a little bit quiet up until the FOMC, it will probably just fluctuate and just roam up and down. And then if traders were betting that the FOMC news is that maybe they’re not going to cut interest rates as as quickly or what they promised or what they said they were going to do. That will send the market down, I’d say if they agree to cutting rates a bit more aggressively, then this market should hold off his level, and we’ll probably see strong buying of this 80,000 number. So that’s that’s for a trader, a very simple trade would be just watching for your your favorite trade signal to occur around this level, and I look to buy off it or look to sell off that number. That would be a very good trade this week. I think you could make make some good returns out of those trades when they set up because this is going to be a very strong pivot zone in the market. Pivots basically act as rotation areas in the market and support resistance areas. So there’ll be a lot of eyes watching the market. So they’re the really the the key, that’s really the key thing to look for in the market. So is how the market reacts around that around 18000 to 18100 number.
Chris: I think it’s, it’s interesting, it’s good to see the visual, because you can see like that, because this week, there is such big news coming up later in the week that the price has sort of attracted itself back to this zone before big announcement. So as you say it is upside and downside depending on what happens. So again, coming back to that word of preparation is being ready to take advantage of it.
Cam: That’s absolutely right, and you never fall in love with a particular trade direction, you never get biased into what’s happening. Because we’re not really, it’s good to have a an idea of what could happen, but as a trader, you need to be very flexible, you need to be able to just change your mind very, very quickly. That’s why you need to have a strategy and a system. You need to have support resistance, you need to have really key levels of support resistance that you want to see certain things occurring around those areas. You know, if if you expect something to happen, and it doesn’t, then you’re going to get a very strong reaction the opposite way. So if so, for instance, in this situation here, we’ve had a lot of buying over the last few weeks buying off this area. So basically what that means is if you’ve got a lot of institutions buying off this level, and if they’ve ever realized that this trade is no longer good anymore, they’re going to sell out of that position.
When you get a lot of sellers selling at one time to create a reaction that’s called a liquidation break or a sell off and you can get a very fast move to the downside. So that’s the thing we don’t know when you just don’t know when those moments are going to occur. As a trader you’re not always there when the market moves. But when you’re there and it moves, be prepared and ready, you can take very good advantage of that. This is a very key area right now, there’s a saying, no strong support, if it breaks, it can become resistance. So that’s what we want to see, as a trader, you want to see this zone.
Let me just draw an arrow, you want to see, we’ve seen this zone break here on Friday, there, you want to see the market come back into that zone. And then ideally, if you’re going to look for sells, you’d be selling down to that zone here. If the market holds here, if there’s the traders are very positive, investors are positive about the news, then we’ll probably like to see markets really take off again from here. So very key pivot point in the market. We want to try and make it as simple as possible and not too complicated. And, you know, it really is common sense trading. And sometimes we get so caught up with indicators and all these sorts of things. It’s that you really need to simplify what you’re looking for. And, and that’s the great thing about charts, charts will show you what’s been happening in the past and whether that that pattern is going to continue.
You want to see, for instance, markets going to continue to go up, you want to see buyers buying off these areas again, and in the institutions holding that position, right, the institutions want to make money, they don’t want to lose money. So that if their trade is not working anymore, they’re going to start to get out of the market. And that maybe that will that’s what happened on Friday particular traditionally, you know, we had quite a strong sell off early than the market stabilized later. Maybe the market was showing its hand there maybe dumping some contracts into the market. So we’ll just wait and see. And remember, always just to to not get emotional, follow your plan, and just be very patient.
Chris: Well, definitely a exciting week ahead. We’ll probably wrap it up there for Episode One because we’ve got weeks and weeks ahead of us where we’ll dive deeper into all these different topics, I’m sure you’ll love to explain in detail all these little nuances that you find in the market.
Cam: Absolutely. Thanks, Chris.
Chris: Nice Cam. Fantastic start and we’ll see you again soon.
Cam: Thanks so much. Good luck in the markets everyone this week. Stay safe. Good bye
