Knowing how to read candlestick charts as a day trader is crucial. Trading candlestick patterns is one of the most common forms of chart trading among Day Traders, making it especially important for every beginner day trader to know exactly how to read candlestick charts.
Candlestick charts are available across pretty much all trading platforms and all markets. Taking some time to properly learn how to analyse candlestick patterns will allow beginner traders to identify trades and the risk reward ratio for day trading before they make any trades.
What are Candlestick Charts?
A candlestick chart is a type of trading chart that shows price action in a given market. A candlestick is the graphical depiction of this price action.
It’s important for a day trader to know how to read candlestick charts. This is the foundation to understanding price movement, which will in turn help ensure low risk day trading when you finally enter the market. Candlesticks are a tool that will help a trader perform technical analysis. This analysis will tell the trader when to buy and when to sell.
Candlestick charts are popular because they provide a detailed overview of information in a simple graphic.
![How to Read Candlestick Charts [13 Candle Examples] 2 candlestick chart definition - chart example](https://idta.com.au/wp-content/uploads/2022/01/how-to-read-a-candlestick-chart.jpg)
Candlestick chart example from trading view charting platform
History Of Candlestick Chart Patterns
Candlestick charting first appeared in Japan in the 1700s, devised by Munehisa Homma. A rice trader, Munehisa applied candlestick charts to the rice futures markets.
The book “Japanese Candlestick Charting Techniques” introduced candlestick charts to a broader audience. These charts are now used across the world and across many types of markets.
Reading Candlestick Charts
Candlestick charts depict price movement over varied periods of time. A trader can set a candle to represent anywhere from 1 minute to broader timeframes like 1 month.
Candlesticks get their name from looking like, well… a candlestick.
What is a Candlestick?
Candlesticks have 3 main parts, a body, an upper wick, and a lower wick. Some traders refer to the wicks as shadows.
These candlesticks can be either green or red, the colour will depend on whether price went up, or down. A green candle is “bullish” and a red candle is “bearish”.
There are 4 attributes for price over a period of time and each candle will display all of these elements.
At the beginning of each candle there is an opening price, and at the close of the candle there is a close price. There is also a high, which is the highest point reached in that period, and a low which is the lowest point reached.
The body of the candle represents the distance between the open price and the close price. The upper and lower wicks show the highs and lows for that candle.
![How to Read Candlestick Charts [13 Candle Examples] 3 reading candlestick charts - example of what candlesticks tell a trader](https://idta.com.au/wp-content/uploads/2022/01/candlestick-chart-how-to-read-candlesticks.jpg)
Single Candlestick Patterns
If you’ve only just started researching how to analyse candlestick patterns, then it may feel overwhelming to learn that there are multiple different types of candlesticks. But not to worry – we’ll unpack each type of candlestick you’ll come across when day trading, and how to best read them. It doesn’t take too long to get the hang of each type of candlestick for most people.
Each type of candlestick offers different insights that can be recognised by analysing its distinct features. Here are 7 of the most common candlesticks every beginner day trader should learn to read before they develop a day trading strategy.
Doji Candlesticks
A Doji candlestick forms when the open price and close price are close together. This gives the candlestick little or no real body.
A Doji candlestick signifies indecision and tends to proceed a reversal. This is neither bullish or bearish by itself, the direction of the reversal depends on the preceding candlestick.
For example, if the previous candle is bullish then there may be a reversal to the downside. For the sell signal to occur the following candlestick needs to close below the body of the Doji.
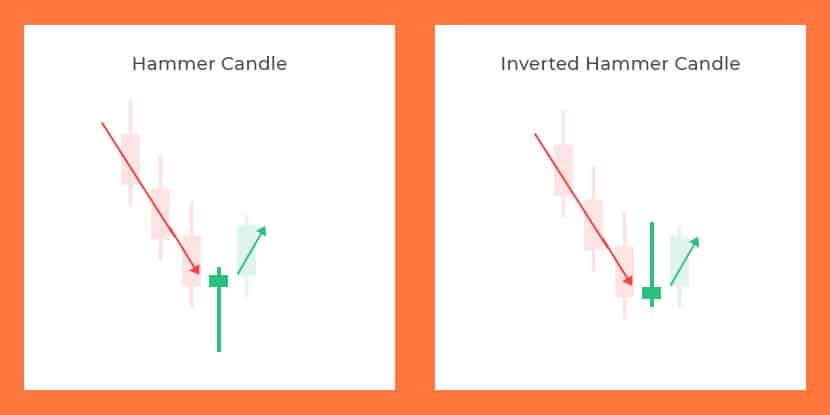
Hammer and Inverted Hammer Candlesticks
Hammer and inverted hammer candlesticks have a small body and one wick longer than the other. The body of the candlestick is the hammers head and the longer wick is the handle.
Both suggest a likely bullish reversal. Hammers and Inverted Hammer’s will form at the end of a downtrend showing a weakening of sellers. Price has created a new low at the bottom of the wick and the buyers have pushed price back above the open.
For a Hammer/Inverted Hammer to be true its handle must be at least twice the size of the body of the candlestick body.
The following candle will need to close above the low or the body of the preceding hammer to be a buy.
Hanging Man and Shooting Star Candlesticks
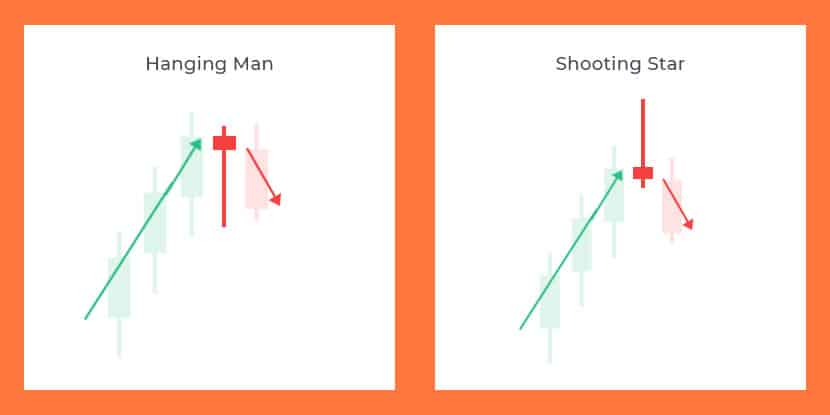
Hanging Man and Shooting Star candlesticks are similar to Hammer candles but indicate a bearish reversal.
Both suggest a likely bearish reversal pattern. Hanging Man and Shooting Star will form at the end of an uptrend showing a weakening of buyers. Price has created a new high at the top of the wick and the sellers have pushed price back below the open.
For a Hanging Man and Shooting Star to be true it’s wick must be at least twice the size of the body of the candlestick body.
The following candle will need to close below the high or the body of the preceding hammer to be a sell.
Dragonfly and Gravestone Candlesticks
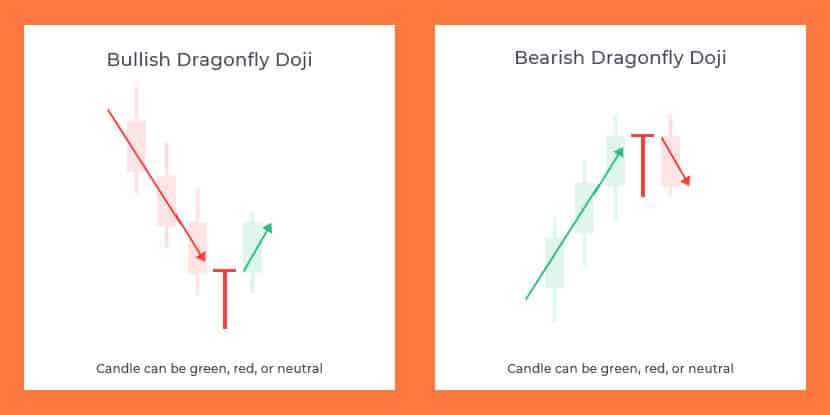
A Dragonfly Doji is a candlestick that resembles a dragonfly, meaning it has a short body and a long lower wick. This type of candlestick can indicate a potential reversal either up or down.
The long tail forms as sell-offs push price down followed by a strong pushback from the buyers.
Following a downtrend, the Dragonfly candlestick may signal a price rise is forthcoming. Following an uptrend this candlestick may signal a reversal to the downside.
In both cases, the candle following the Dragonfly Doji needs to confirm the direction.
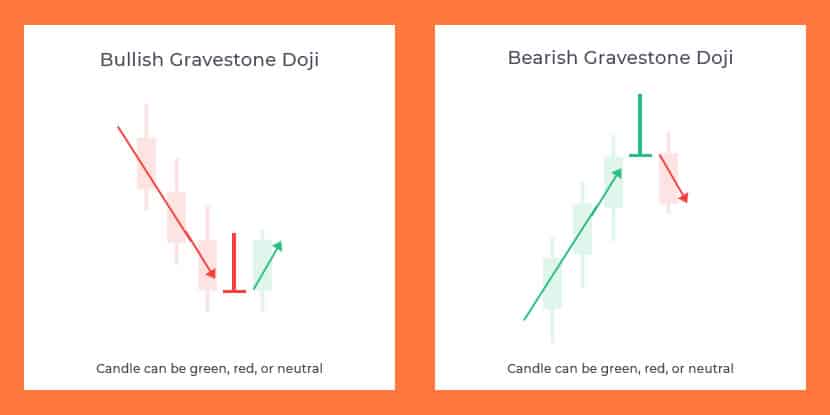
A Gravestone Doji is the inverse of a Dragonfly Doji. The Gravestone Doji has a short body and a long upper wick. This indicates that buyers were able to push price up. The sellers were then able to consolidate and close the candle out close to the opening price.
Following a downtrend, the Gravestone candlestick may signal a price rise is forthcoming. Following an uptrend this candlestick may signal a reversal to the downside.
In both cases, the candle following the Gravestone Doji needs to confirm the direction.
Spinning Top Candlesticks
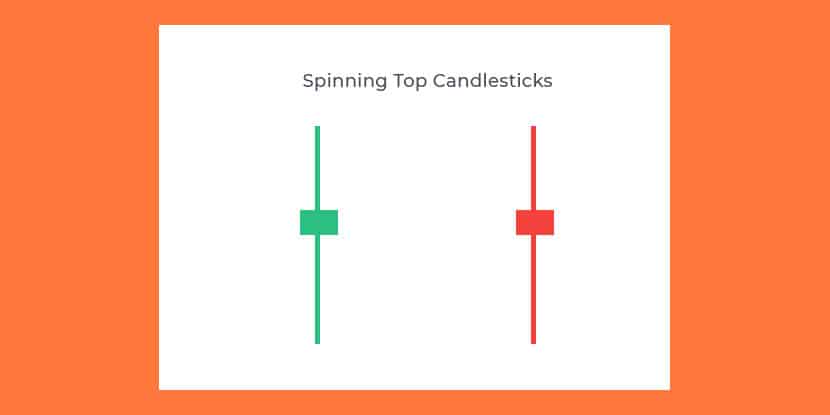
A spinning top candle is a little like the combination of both a Dragonfly and Gravestone Doji. This candle has a short body with a long upper wick and a long lower wick of roughly the same size.
This type of candle indicates that there is indecision between traders, neither buyers or sellers were able to dominate the entirety of the candle. Indecision like this can suggest potential sideways movement to follow.
A spinning top can also indicate a potential reversal from either an uptrend or downtrend. A green spinning top can be viewed as a bearish candle, a red (sellers) spinning top can be viewed as a bearish candle.
2 Candle Patterns
The candlestick patterns that we’ve looked at thus far have been single candles, let’s look at some 2 candlestick patterns. These are candlestick patterns that comprise of 2 candles, where the indicating candle is compared to the previous candle to indicate a potential move.
Engulfing Candlestick Pattern
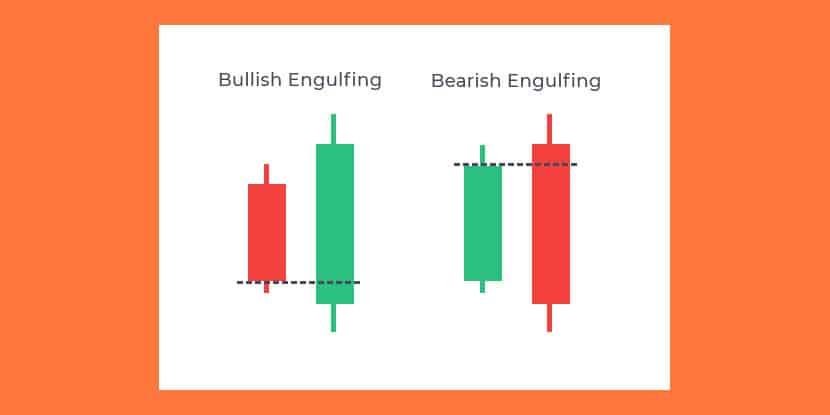
An engulfing candlestick is one that engulfs the prior candle. The body of the engulfing candlestick will be larger and have its open and close at higher and lower points.
A bullish engulfing candlestick has an open price below the close of the previous candlestick. The close will also be above the open of the previous candlestick. So, the previous (red) candlestick fits inside the engulfing (green) candlestick if overlaid.
The bullish variants are a potential reversal on downtrends, and continuation on uptrends. The opposite is true for bearish engulfing candlesticks.
Harami Candlestick Pattern
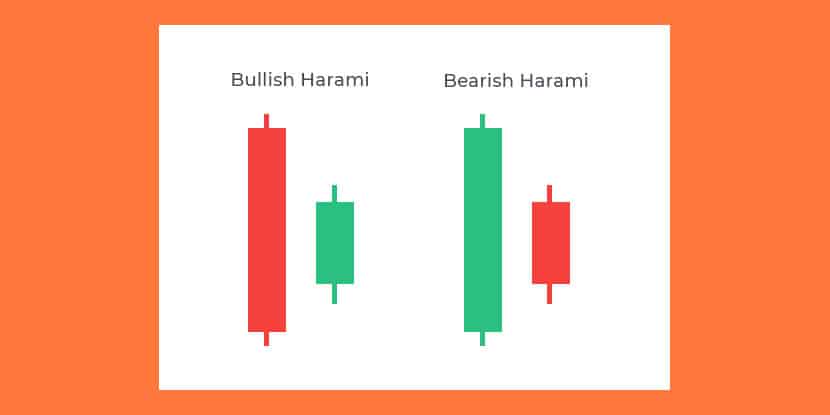
The word Harami is derived from the Japanese word ‘pregnant’, the pattern looks similar to a pregnant woman. The pattern begins with a larger (pregnant) candle followed by a smaller one (child). You’ll notice that a Harami pattern looks similar to an Engulfing candlestick pattern, the difference is that the larger candle comes first. In contrast, an Engulfing pattern has a smaller candle followed by a larger one.
The second candle in this pattern will gap up and be completely contained within the prior candle.
A Harami candlestick pattern is an indication that the current trend is slowing and there is a potential reversal about to form. This comes from a gapping in the reversed direction.
3 Candle Patterns
While 3 candle patterns are no more valid than 1 or 2 candle patterns, they do add further context compared to 1 and 2 candlestick patterns. These patterns tend to appear after a trend and either indicate a continuation, or a reversal of the trend.
Three White Soldiers Candlestick Pattern
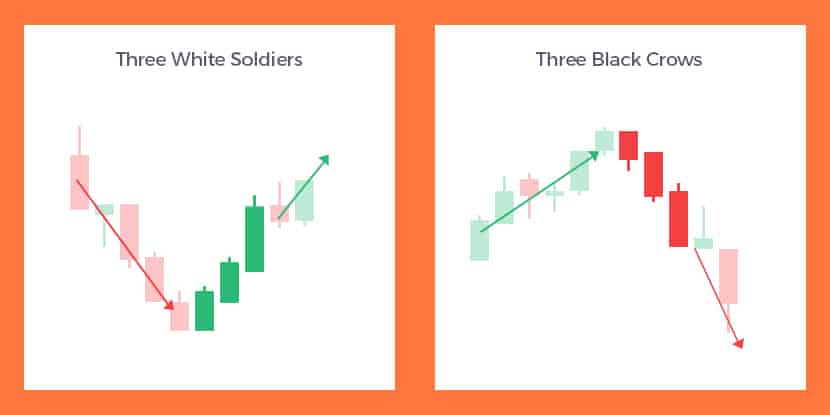
A Three White Soldiers pattern consists of three buying candles, one after the other. The candles each open within the body of the previous candle, and close above the high of the prior candle.
This is one of many bullish candlestick patterns, it requires large bodied candles with small or no bottom wick. Small lower wicks indicate that there is not much push back from the sellers and that the buyers are firmly in control.
This candlestick pattern is an example of a reversal pattern and a change in market sentiment.
Three Black Crows Candlestick Pattern
The Three Crows pattern is the inverse of the Three White Soldiers chart pattern. This is one of many bearish candlestick patterns, it indicates that market sentiment is reversing to the downside after a prior uptrend.
The pattern consists of three consecutive red candles. The candles each open within the body of the previous candle, and close below the high of the prior candle.
The pattern is strongest when there are large bodied candles with small or no top wick. This means there is not much push back from the buyers and that the sellerss are firmly in control.
This candlestick pattern is an example of a reversal pattern and a change in market sentiment.
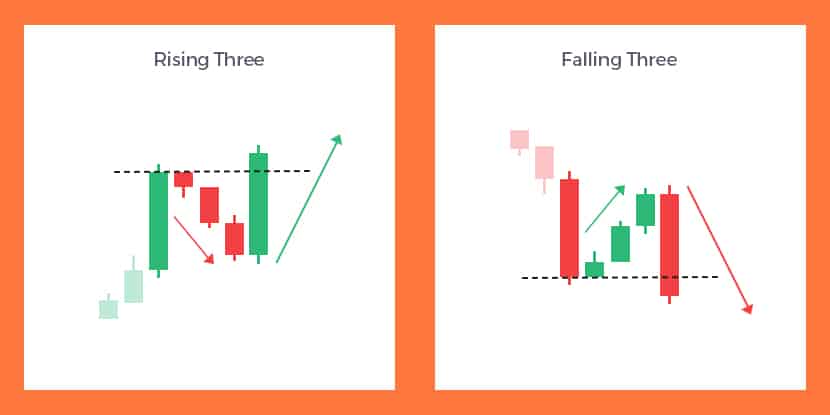
Rising Three Candlestick Pattern
A Rising Three candlestick pattern is an example of a continuation of the trend. The continuation happens after a slight pull back against the trend.
Here ‘rising’ refers to the rising of the trend, not the 3 candles, which are actually the pullback.
This candle pattern forms when there is an uptrend followed by three red candlesticks in a row. Each of these red candles have small bodies and ideally remain within the range of the most recent green candle.
The candle pattern is confirmed by a dominant green candle, preferably breaking above the most recent green candle. This indicates that the trend is strong and the market is bullish.
Falling Three Candlestick Pattern
A Falling Three candlestick pattern is an example of a continuation of the trend to the downside.
Here the downtrend sees a small pullback to the high-side where eventually the sellers win back control.
Again it’s ideal that each of the green candles have small bodies and remain within the range of the most recent red candle.
The candle pattern is confirmed by a dominant red candle, sandwiching the 3 candles between 2 strong red candles. This indicates that the buyers couldn’t break the trend and the market is bearish.
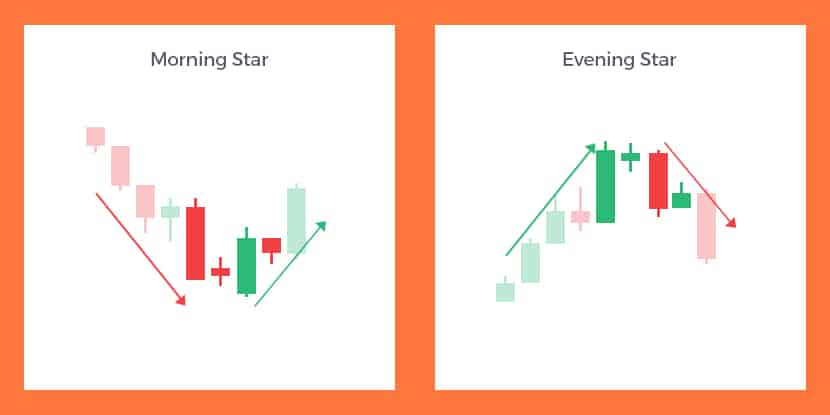
Morning Star Candlestick Pattern
The Morning Star candlestick pattern is an example of a reversal pattern. In this pattern, the sellers begin to lose control of the trend as the volume of buyers picks up.
To complete a Morning Star candle pattern there needs to be a strong trend to the downside to begin the pattern. The first candle in the 3 candle pattern is a dominant green candle, followed by a red candle with a small body. This is an indication of the seller running out of strength. The final candle in the candlestick pattern is a dominant green candle which shows that the buyers are taking control.
A trader may take this as an entry point, others may choose to wait for further confirmation of the reversal
Evening Star Candlestick Pattern
The Evening Star candlestick pattern is the inverse of the Morning Star candle pattern. In this pattern, the buyers have trended the market up. The buyer then begin to lose strength before the market typically reverses.
To complete a Evening Star candle pattern there again need to be a strong trend, this time an upward trend. The first candle in the pattern should be a strong green candle. This is followed by a short bodied green candle, hinting that the buyers are losing control. The final candle is a dominant red candle showing that the sellers are beginning to take control.
Again, a trader may take this as an entry point, others may choose to wait for further confirmation of the reversal
Bullish Candlestick Patterns
There are 2 main types of candlestick patterns. These are bullish candlestick patterns and bearish candlestick patterns.
A bullish candlestick pattern is any pattern that indicates a strong buying sentiment from “bulls”. These patterns indicate the price will rise in the near future.
Bullish Candlestick Patterns in this article:
- Hammer
- Inverted Hammer
- Bullish Dragonfly
- Bullish Gravestone
- Bullish Engulfing
- Bullish Harami
- Three White Soldiers
- Rising Three
- Morning Star
Bearish Candlestick Patterns
A bearish candlestick pattern is any pattern that indicates a negative sentiment from “bears” who are looking to push price down. These patterns indicate the price will fall in the near future.
Bearish Candlestick Patterns in this article:
- Hanging Man
- Shooting Star
- Bearish Dragonfly
- Bearish Gravestone
- Bearish Engulfing
- Bearish Harami
- Three Black Crows
- Falling Three
- Evening Star
How To Analyse Candlestick Chart Patterns
As mentioned earlier, candlesticks provide the information for traders to base their decisions on. It’s also important to understand the context of each candle.
When several candlesticks complete, they can form trading patterns. This can change the context of a single candle so it’s important to understand the context. Most of the above candlesticks are single candle patterns, there are also 2 candle, and 3 candle patterns, as well as patterns formed by dozens of candles.
Examples of 2 candle patterns are Engulfing candles, and Harami candles. Some 3 candle patterns include 3 white soldiers and 3 black crows. There are many trading patterns that contain a larger number of candles, some examples would be ascending channel, falling wedge, ABC patterns and so on.
The best way to analyse candlestick charts (once you’ve learned some) is with a trading platform. A trading platform will allow a trader to markup a chart with drawing tools and indicators that help find these patterns.
Bottom Line
The first step to trading is learning these patterns and practise identifying them using a trading platform. It’s best to do your practising on a simulated “paper trading” account where you aren’t risking real money.
By now you should have a basic understanding of how to read candlestick charts. To learn more about candlestick charts you can join us for our next Free Trading Class and receive a complimentary eBook about trading for beginners!

![How to Read Candlestick Charts [13 Candle Examples] 1 how to read candlestick charts](https://idta.com.au/wp-content/uploads/2022/01/how-to-read-candlestick-charts.jpg)
![How to Read Candlestick Charts [13 Candle Examples] 4 Free day trading web class](https://idta.com.au/wp-content/uploads/2020/08/free-day-trading-web-class.png)


