Beginners guide to Day Trading
Introduction to Day Trading
It used to be the case that you had to be part of a large financial institution to trade the markets. As technology advanced and the internet became available to the average household, this began to change. Brokerages made it easier for the consumer to access the markets.
Day Trading is becoming more and more popular with mum and dad investors globally. Why? It is a skill set that can be learnt quickly and doesn’t need a tertiary degree to get started.
Day trading offers a potential income stream with no staff, drop shipping, suppliers, or customers. Day Trading is a mobile business, all you need is a sound internet connection.
You can trade from anywhere in the world using a laptop, trading software, and internet connection.
What is trading and how does Day Trading differ from other kinds of trading?
In this section of our Beginner’s Guide to Day Trading, we will define what Day Trading is and how traders can look to take advantage of the markets.
Day Trading describes the buying and selling of a security within the same trading day. This means that a trade is both opened and closed within that trading day. There are many markets available to trade, and in many different ways. The most common forms of Day Trading include Stocks, Forex, Futures, and Options
Day Traders seek to predict the movement of a market in the short term and profit from that movement. If a trader predicts the market will go up, a Day Trader will seek to buy into that market with the intent of getting paid. If a Day Trader predicts the market will fall, they will ‘short sell’ with the intent of making profit from the fall.
Day Traders can use technical analysis and/or fundamental analysis to make their trading decisions. What’s the difference?
Technical traders tend to use the pure price movement of the market to predict where the market is going to go. Traders use trend lines, support/resistance levels and historic price to predict moves in the market.
Fundamental Traders look at economic news such as earnings reports, and acquisitions. They try to predict movement based on market sentiment. Positive news such as a large earnings beat, for example, can be a sign that price may move up.
Speed of entering and exiting trades
Day Traders are able to enter and exit trades with speed, intending to lock in trading profits on a daily basis. This means that there is a potential to compound this return daily and grow capital. Be aware that a careless trader can also compound losing trades on a daily basis. There are two risks in trading, making money and losing money every time you take a trade.
As a Day Trader, you need to maintain a risk profile and remain disciplined. It’s recommended that Day Traders should only take high-probability trades.
Day Traders, don’t hold trades out of market hours, particularly over the weekend. They do this to protect against unexpected news that may rock the markets. As a Day Trader, my suggestion is to follow the same principle. Seek to protect yourself against market dynamics you can never hope to control. Simple principle, do not hold trades in the markets when they are closed.
Day Trading takes advantage of fluid markets, capitalising on fast price movements. As a short term trading strategy, leverage is often used to increase the potential return. Trading leverage adds risk and can lead to larger losses also. It is important to manage risk and be cautious when using leverage.
How does Day Trading Work?
People are able to Day Trade using specialty software called a trading platform. They can do this either via a broker, or directly to a stock exchange. We access the exchange directly and receive the “true price”, not the price that the broker chooses. Traders connected to an exchange use a clearing house, negating a conventional broker.
A trading platform provides you with real time data for a given market and displays this data in the form of a chart. It is this chart that you use to make your market predictions. The trading platform also allows you to execute trades, live into the markets, when you choose to.
Day Trading markets and products
In this section we will look at popular Day Trading markets and why Futures is our market of choice.
One of the decisions that you will need to make before you start learning how to trade, is which market you want to trade.
Traders should concentrate on one market, this helps narrow focus and allows them to become familiar with that market.
The most popular Day Trading markets for are the Stock market, Foreign exchange (Forex), Options, and Cryptocurrency. A lesser known Day Trading opportunity is the Futures markets. We choose to trade Futures over all other forms to avoid traditional brokers.
Trading Stocks
The stock market is where traders can buy and sell shares in a given company. The stock trader seeks to take advantage of price movements of a given stock. There are a few types of stocks, including large cap (blue chips eg. Google, Microsoft, Tesla etc.), medium cap, and penny stocks (priced lower than $5).
Trading Forex
The Forex market is the most common marketed globally and attracts a lot of traders. Forex traders exchange one currency with another in the form of “currency pairs”. For example, a trade placed on USD/JPY which would be dependent on the price of the USD (Dollar) against the JPY (Yen).
We find that because Forex trading is an Over The Counter (OTC) product, there is a lack of transparency. For example a broker decides the price you’re given which you accept at face value. This may not always be the true price. With OTC products like Forex, the nature of transactions allows for issues with market integrity.
For those who want to trade currencies, we believe there is a better way. We choose to trade currency pairs on a Futures Market contract. This allows for greater transparency and fairness in price. Price is set at market level and not via a dealer group such as a broker.
I outline this in further detail in my article Futures vs Forex.
Trading Futures
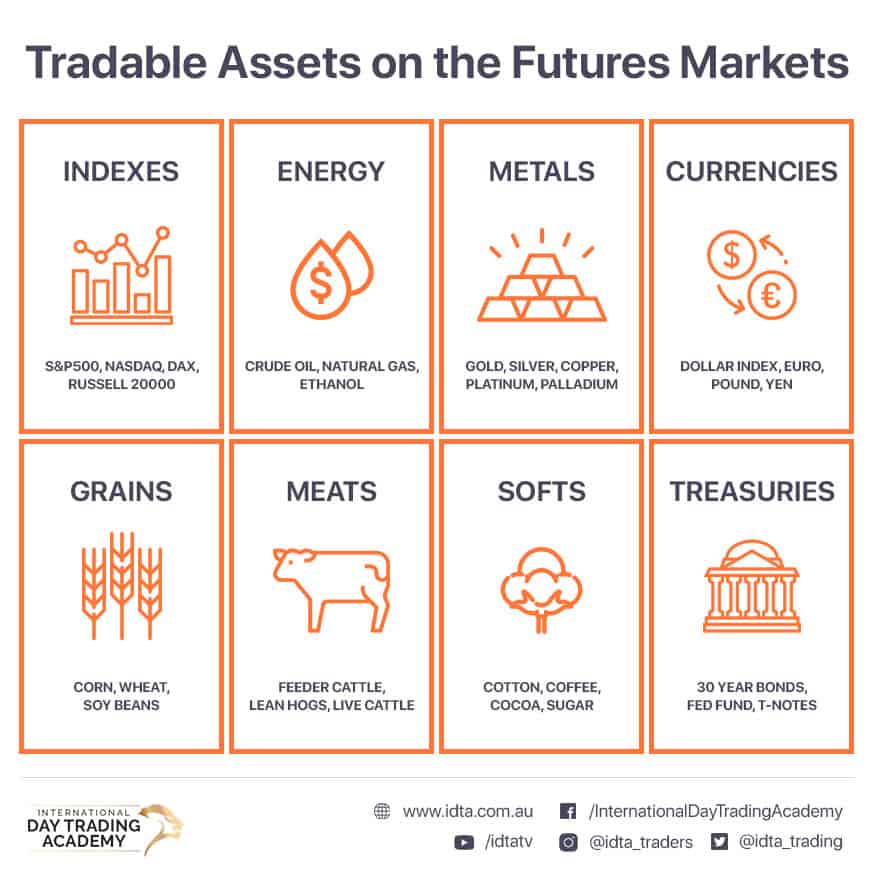
What sets Futures apart from Stocks and Forex is it provides the opportunity to trade many asset classes. A Futures trader can place trades on an Index such as S&P500, Gold, Oil, Wheat, or even currency pairs.
Futures are a form of derivative, they are a contract between buyer and seller. The contract is to deliver an asset at a predetermined date and future price. A Futures contract describes the quantity of the underlying asset, the price value at execution, and the expiry date of the contract.
Futures traders do not have to trade via a dealer group such as a broker as OTC products like Forex do. Futures traders use Clearing-houses with a direct connection to a regulated Exchange. Futures provide data from a regulated exchange with transparency and fairness for all traders
One of the reasons that we choose to trade Futures over any other product is the level playing field that it offers.
What makes Day Trading different?
Compared to traditional holding stocks over a long period of time, Day Trading provides much more control over outcome. I refer to someone who buys stocks and holds them over the long-term a “BHP” or Buy Hold and Pray Trader. These traders buy stock hoping it goes up with no defence against the market falling.
Day Traders begin with a strategy that allows them to trade the market both up and down. A day trader moves with the ebb and flow of the markets, rise or fall.
Short term directional trading allows quick decisions and quick risk control if required. A trader can set a stop-loss to minimise risk, take partial profits to de-risk, or set long range targets and let the market run. All options are available to a talented short term day trader.
Day Traders seek to take advantage of sharp movements in the markets caused by volatility. The further that price moves over a short period of time, the more potential for return. Of course this also works the other way, a sharp movement against a trader will create a large loss. Always use risk management techniques to minimise risk.
The key components of Day Trading are, data analysis and risk management. A trader needs to be able to identify high-probability trades, and manage risk. It is best to have a set entry and exit in mind before placing a trade, this removes some of the emotion. This will also allow you to concentrate on managing a position accordingly.
Day Trading can provide the opportunity for a secondary income, or can be a full time job, provided you do it well. But, it’s not easy and many beginner traders fail. It is imperative that you have a solid strategy and trading plan before trading real money.
Before You Start Trading
In this section, we will look at what you need to know and what you need to do before you begin trading.
There is a lot of information online about how to day trade, so much so that it is overwhelming. It’s tempting to read a few blog posts, watch a handful of videos and then open an account and start trading. There are some things that you need to do to fully understand how to get started with Day Trading.
First, you must have a solid knowledge of the fundamentals of trading. You also need a basic understanding of the fundamentals of trading. You also need a basic understanding of market design and technical analysis.
A good place to learn the basics of Day Trading markets is with one of our courses in day trading futures for beginners.
Second, you need a proven strategy that has shown to be profitable over an extended period of time that also aligns with your risk appetite. Third, you will need to have practised all the above. It is important to trade in a simulated environment (trading with fake money) before you risk your own money. If you can prove to yourself that you can be successful with your strategy, you can then trade it on a live account.
Understanding the fundamentals of Day Trading
If a person wants to become a plumber, accountant, doctor, or any other professional, you need to study. It is the same with trading, you can do a little reading on the subject, but to be good at it you need to have a solid foundation.
Of course you can study online at no cost, but getting information from many sources can be difficult. Often what one person tells you, another completely contradicts, meaning it can be hard to know what is right.
The people who are providing information online aren’t all trading the same strategies either. You are far better off learning one or two strategies from one source very well than to learn a little about many different strategies.
The first thing you should learn about trading is basic terminology. You will need to know how the markets work, and how they are structured, and then move onto strategy.
Learning to trade with an academy means information is consistent, and relevant to a proven strategy. A support structure is in place to ensure that you understand what you’re learning and to provide guidance. We do this for all that take our trading courses and provide practical assistance through the Live Trading Room. The trading room allows you to practice your skills.
Understanding market design
It’s essential that you understand market design if you want to be successful at trading.
Trading Forex, Options, CFDs, Stock, Cryptocurrency, Binary Options markets are all done via OTC Brokers. This means that you are trading a market created by the Broker, not trading the actual stock exchange.
This is why OTC Brokers were originally known as market makers; they ‘make the market for you to trade in’. As they ‘make the market’, they can also manipulate the market against you whenever they want to.
Futures trading is one of the only trading disciplines in the world that is devoid of OTC Brokers. Because of this it is also devoid of their market manipulation potential. This is why we teach Futures trading, we’re are also one of the only futures trading schools in South East Asia!
Adapting or creating a profitable Day Trading strategy
Some beginner traders create their own strategy, but it is difficult to do with little knowledge. For this reason beginners tend to adapt an existing strategy that they feel can be successful for them.
Having a strategy helps you focus on one asset class/market at a time, looking for only one or two types of pattern. Without a strategy, it is easy to become overloaded with choice. It is always best to stick with one market, and one or two strategies. If you do this it becomes easier to become more consistent with that method.
Understanding Day Trading psychology
Most beginner traders are surprised to learn that psychology plays an extremely important role in trading. In fact, it is often said that trading is 80% mindset and 20% fundamental or technical skill. Many traders fail by not addressing the psychology of trading.
Money has a strong power over our emotions and a trader that can manage these emotions has a huge advantage over those that can’t. There are many traps to avoid when it comes to trading psychology. These traps can include fear, greed, and arrogance, which all have the ability to hinder your trading.
It is imperative that you treat trading psychology with respect. Understand and manage as best you can to have success in trading.
Practising Day Trading
Simulated trading, or “paper trading” is an essential part of learning how to day trade. A simulated environment allows you to practise trading without risking your own money.
Many trading platforms offer software that can execute trades on an account that holds fictitious funds. A trader needs to prove themselves profitable with fake money, over a sustained period, before they trade real money.
Trading charts
In this section we will look at what trading charts look like and how traders use them to predict price movement.
Trading charts are an essential tool in the traders arsenal. In order for a trader to be able to perform technical analysis they will need to view historical (and live) data. Trading charts allow a trader to view price action over any given period of time and will relay live information about movement. This information allows a trader to identify “good trades” based on their strategy, as they arise.
Types of trading charts
Line charts
Line charts are the simplest form of trading chart, they show the movement of price but offer far less information than other charts. A line chart has 2 data points, time and price. A line chart displays only the closing price at a given period of time.
Some traders may find line charts useful when looking at long term trends. Line charts might suit trading for beginners due to simplicity. But most traders look to other chart types that offer more information.
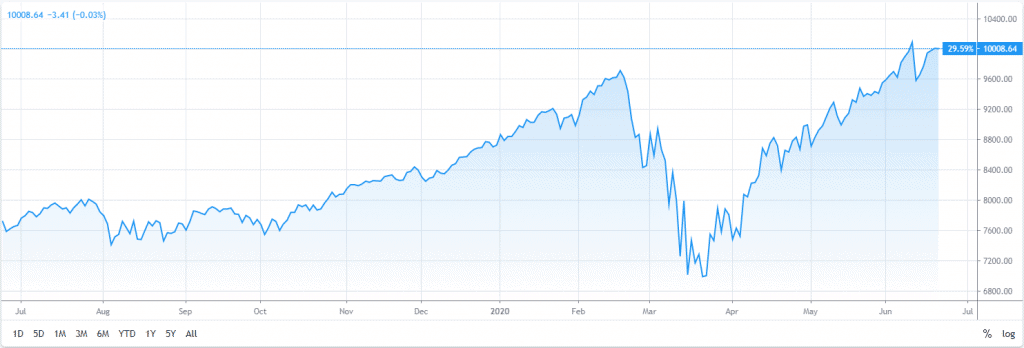
Line chart of NASDAQ index via tradingview.com
Bar charts
Bar charts add more information, as each bar represents a chosen period of time. Bar charts provide information that a simple line chart does not.
Each bar in the chart is a vertical line along with shorter horizontal lines. The vertical line indicates both the low and the high for the given period of time. The horizontal lines represent where price opened and closed for that period of time.
Notice that the graph below shows red bars and green bars; these show whether price went up or down within the duration of the bar. If the bar is green, then the open price will be the bottom horizontal line, and the close will be the upper. For a red bar, the opposite is true, the open will be the top bar and the close will be the bottom.
You’ll also notice from the chart below that the opening price is on the left of the bar and the closing price is on the right.
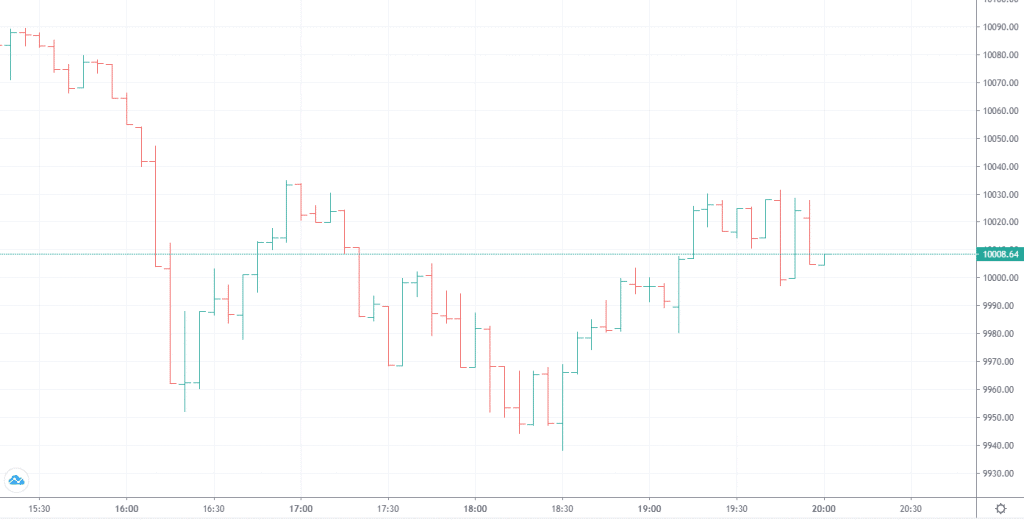
Bar chart of NASDAQ index via tradingview.com
Candlestick charts
Candlestick charts are the most popular among traders. Like bar charts, candlesticks provide the difference between open and close (range) price. They are the most popular amongst traders as they are simple to read.
Candlestick charts offer several pieces of information, including open price, close price, and the high and low for that candle.
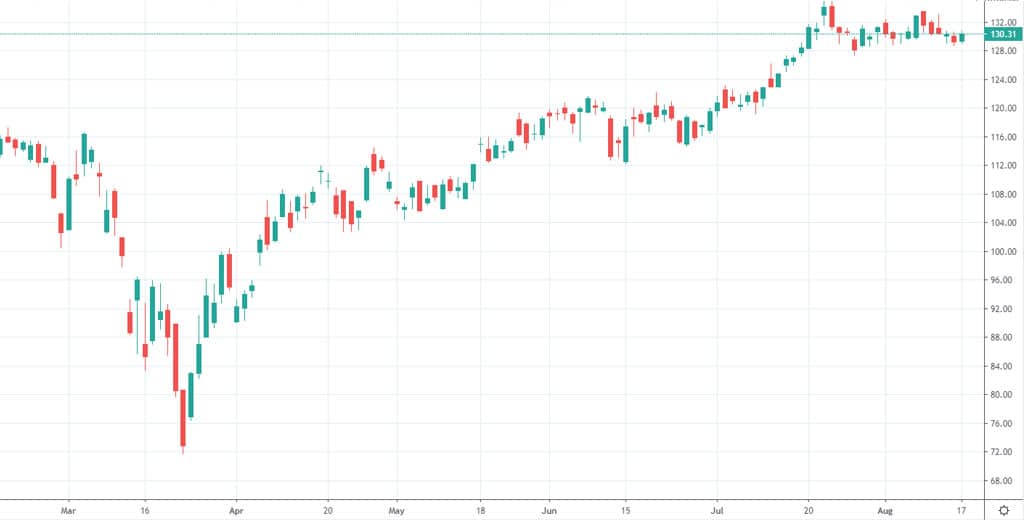
Candlestick chart of NASDAQ index via tradingview.com
How to read candlestick charts
In this section, we will look at reading candlestick charts and understanding the anatomy of a candlestick.
A closer look at candlestick charts
Candlestick charts originated in Japan in the 17th century in the rice trading market. They are still the most popular way of representing data today.
A candlestick chart can be set up so that a single candle represents various periods of time. For example a candle can represent 1 minute, 3 minute, 5 minute, 1 hour, 1 day, etc. The most common candles we use are 5 minute candles. We have found shorter durations (1 minute and 3 minute candles) produce inaccurate signals so we recommend not using them.
Taking a closer look at candlesticks you’ll notice that they offer a few pieces of information. A single candlestick will provide the highs, lows, open and close prices for a given period of time. The below image illustrates how these pieces of information are represented. A candlestick on a trading chart has a body, and wick, hence the name.
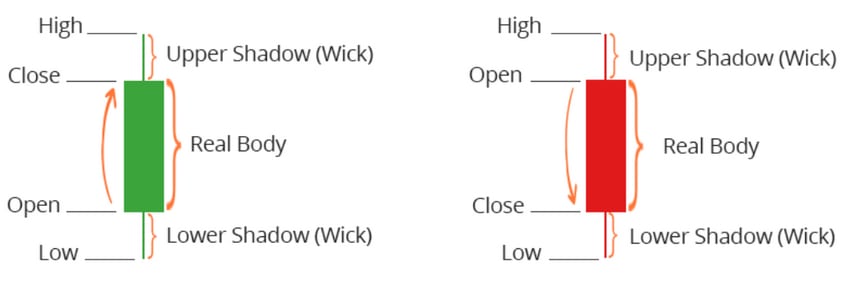
Candlesticks are either green, or red, although most platforms allow some colour customisation. A green candle means that the buyers have owned the candle. A red candle means that sellers have owned the candle. When a candle is green it means that the close price was higher than the open price and price has increased. A red candle means that the close price is lower than the open price and the price has decreased.
The difference between the open price and the close price is called the real body. The longer the body, the more price has changed between the open and the close.
There are two wicks that a candle can have, often called the upper shadow and the lower shadow. The upper shadow shows the highest price reached within the duration of the candle. The lower shadow shows the lowest price reached within the duration of the candle. Not all candles will have an upper or lower shadow. It is possible for a candle to close at a high or low. Should this happen the candle won’t have either an upper or lower shadow respectively.
When the open price and close price of a candle are very close to each other, we call that a Doji candle. These candles represent neither the buyers or sellers being in control. This often indicates that there is some indecision in the market. There is no consensus on where the market is going to move.
How to read trading charts
For a trader to predict where price is more likely to move, they will need to understand what the candlesticks indicate. A single candle by itself does offer a lot of information. It is not until you look at many candles side by side that you begin to have an idea of how the market is moving.
The market is quite random and no single person has ultimate control over price movements. But, when you begin to observe this randomness over a period of time patterns begin to emerge. There are common patterns that historically have indicated the price is going to move in one direction or other. This is how a trader will identify their potential trades.
Tools of the Day Trader
In this section we will look at the different tools that traders use in order to identify and execute trades.
Trading platform
A trading platform is necessary in order to analyse charts, and execute trades. They work by connecting to a given market, typically via a broker. This connection allows the user to view real time information about the market. At the International Day Trading Academy, we use NinjaTrader as our platform of choice and connect directly to the exchange in order to get “true data”. This is the platform we recommend as it also guarantees OTC Broker free trading.
The other key function of a trading platform is to execute trades which involves checking that an account has the funds available for the trade and then sending the request to the exchange to be filled.
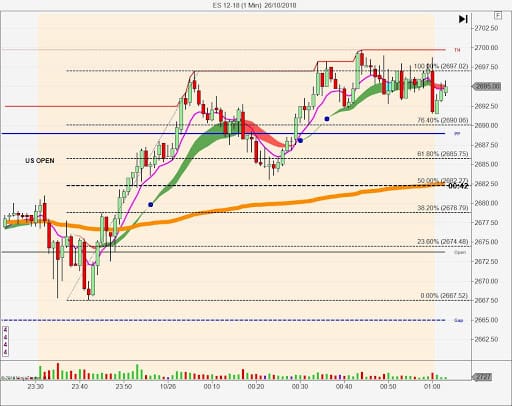
The above is an example of a candlestick chart using the NinjaTrader platform.
Indicators
There are many variations of trading indicators available such as, moving average (MA), moving average convergence divergence (MACD), relative strength index (RSI), Fibonacci retracement and many more.
Indicators are loaded into a trading platform and visually display signals based on mathematical calculations. This information is overlaid onto the chart. While some traders work using “naked charts” (no indicators), it can be useful, especially when starting out, to use indicators to assist in technical analysis.
There are 2 classes of indicator, leading indicators, and lagging indicators. A leading indicator will assist in forecasting future price movements. Lagging indicators focus on past trends and can be used as an indicator of momentum.
Trend indicators:
Moving Average Convergence Divergence (MACD) is an example of a trend indicator, as it assists in analysing the direction that the market is moving in. MACD is wave-like moving between highs and lows whilst establishing a trend if one exists.
Momentum indicators:
Relative Strength Index (RSI) is an example of a momentum indicator, meaning it will tell you how strong a trend is. The RSI indicator can also be used to indicate when a reversal may be about to occur. This indicator can be useful when looking to establish price tops and bottoms.
Efficiency indicators:
Our proprietary efficiency indicator compares multiple inputs to confirm if a particular team has greater overall strength in the markets. We use this to determine whether a team is in command and, as such, how long we should be backing that team for.
Volatility indicators:
Volatility describes the size/speed of the price movement over a given period of time. The more quickly that price moves, the more volatile the market is said to be. Volatility is necessary in order to make profit over short periods of time as it provides more opportunity. It is also the case that it provides more opportunity to lose funds, so it is important to manage risk accordingly.
We use a predictive volatility indicator (PVI) in our proprietary trading indicators. This indicator uses the current volatility in the market to predict the volatility of pending market moves. This is a great indicator for predicting a high probability target zone for the strategies that we use while trading.
Volume indicators:
Volume is a good indicator of how strong a move is. If there is a large amount of volume from either buyers or sellers it indicates that they will be able to move the price more effectively. The more volume there is in the market, the more that price can move and the more quickly it can move.
How to get started with Day Trading
In this section we will look at the resources that you will need in order to actively trade on the Day Trading markets.
It’s tempting to want to dive straight into trading, however there are a few things to consider before you do. It’s important to have the foundations of the markets and technical analysis, know when to trade, and know how to manage your risk.
Day Trading laptop/computer
In order to day trade you want to have a reliable computer. If you have any technical issues while trading your account could end up being negatively affected by you not being able to manage an open trade.
You don’t necessarily need to have a top of the line computer, but be mindful that you should use a computer that exceeds the minimum requirement for your trading software.
Most trading platforms run exclusively on Windows operating systems so keep that in mind if you’re thinking about using a Mac. You can view our recommended specifications for a trading computer here.
How much money do you need to start Day Trading?
In order to trade you are going to need starting capital. It is important to note that you should never trade with funds that you cannot afford to lose. So how much do you need to start trading?
There are 2 things to consider; first, the clearing house will have a minimum requirement for opening an account with them. Some will allow you to open an account with as little as $500, where others may require $5,000 or $10,000. If you have an account of just $500 you will be limited to trading the micro markets where there is a minimum of $50 margin requirement per trade.
At the end of the day, the starting capital should reflect your goals as well as your risk appetite, there is no set rule for where to begin.
When do Day Traders Trade?
There are many sessions that a Day Trader can trade. This provides some flexibility and can help fit into most lifestyles. Some of the more popular Day Trading sessions are:
| Market | Local Time of Market | Australian (AEST) |
|---|---|---|
| European Open | 7:00am to 9:00am (London) | 5:00pm to 7:00pm |
| European Close | 2:00pm to 4:00pm (London) | 11:00pm to 1:00am |
| U.S. Pre-Market | 8:00am to 9:00am (New York) | 9:00pm to 11:00pm |
| U.S. Open | 9:30am to 11:30am (New York) | 11:30pm to 1:30am |
| U.S. Close | 2:00pm to 4:00pm (New York) | 4:00am to 6:00am |
| Australian Session | 8:00am to 5:00pm (Sydney) | 8:00am to 5:00pm |
*Subject to daylight savings time
The International Day Trading Academy covers the European Open, U.S. Pre-Market and U.S. Close in the Live Trading Room Monday to Friday. Each trading room session runs for 2 hours.
When is the best time to Trade on Day Trading markets?
Day Traders typically trade either the open or close of the session for their given market. The first or last hour of the session typically has the most volume, which offers more opportunities when it comes to price movements. Therefore most traders consider these times to be the best time to trade.
The pre-market can also be traded but is less popular globally. Why? Volume is low and hence predictability is also low. Highly successful traders wait for the true market to open and hence do not trade pre-market sessions.
Choosing a market to trade
Obviously it is important to choose a market that is trading at a time that suits your lifestyle, but what else should you consider when choosing a market to trade. There are 3 main things that are required of a market that makes it attractive to trade.
Liquidity: A liquid market will allow a trader to enter and exit a trade quickly. Without liquidity, a trader may be waiting for their buy or sell order to be actioned, simply because there are no buyers or sellers readily available. The Futures markets are particularly liquid, which is one of the reasons we choose to trade them.
Volume: Volume describes the number of contracts being exchanged by buyers and sellers at a given point in time. A market with a high level of volume will have more liquidity and can provide larger movements if momentum begins to occur.
Volatility: Volatility will indicate how far price is able to move. The more volatility in a market the more opportunity there is to make large profits. Remember, where there is an opportunity to make greater profits there are also risks of making greater losses. Always observe risk management techniques when trading a volatile market.
Day Trading strategies
In this section, we will look at the different types of Day Trading strategies available.
Range trading
The markets spend most of their time within a given range, big moves are not an everyday occurrence. There are typically common highs and lows that the market or an equity will trade in between. Trading ranges can be found between multiple timeframes, there may be a common range over a daily, monthly, yearly, period of time.
The two extremities of a trading range are called support and resistance. Support is the low point of the range where price tends to bounce off of in an upward direction. Resistance is a price that is difficult to break through and typically price will bounce off of resistance and move lower.
A range trader will first identify the levels of support and resistance and then trade whichever direction the market is likely to move (shorting resistance and placing a long trade upon support).
Breakout trading
A breakout or momentum trader will trade in a similar way to a range trader in that they concentrate on the range currently being traded. Knowing that a range doesn’t last forever, a breakout trader will look to take advantage of either support or resistance being broken. A breakout trader will use other data such as volume to determine whether a trade will continue after breaking out of a trend.
Trend trading
Whether the market is trending in an upward direction or in a downward trend, a trend trader will seek to follow what they deem to be steady movement. Essentially a trend trader will look at a chart over some given period of time (yearly, monthly, daily etc) and identify when price is moving constantly in one direction or another.
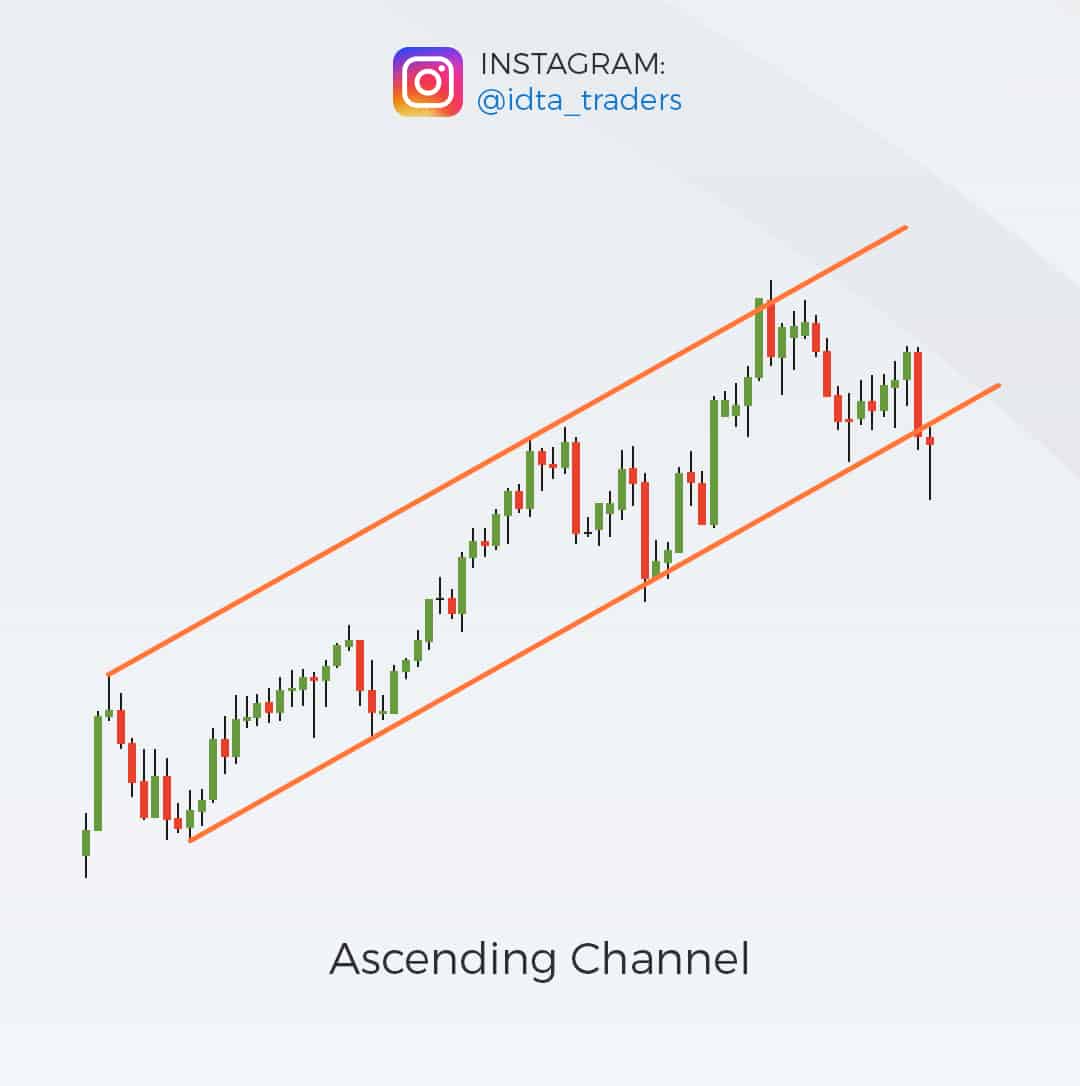
The example below is an ascending channel, this is an uptrend that trades in between support and resistance levels. Notice that price bounces off support and resistance (in this case trend lines). Price continues to follow the bottom trend line and trends upward.
Swing trading
Swing trading strategies are different to Day Trading. Swing trading occurs over a period of a few days rather than within the same trading session. A swing trader will use technical analysis the same way that a Day Trader would, but would also look at fundamentals. Swing trading has the added risk of holding overnight positions that is are not present in Day Trading.
Scalping
What is Scalping? Scalping describes high frequency trading that seeks to take advantage of small movements of price over short periods of time. Traded often, if successful, those small movements add up. It is important when scalping to have very strict exit points as a large loss can wipe out the handful of profitable trades that preceded it.
There are many methods of trading out there, these are just a few of the popular choices.
Day Trading patterns for beginners
In this section, we will look at some Day Trading patterns that are a good starting point for beginner traders.
The great thing about trading patterns is that a pattern doesn’t need to be complicated in order to be effective. Many people think that a more complicated pattern or strategy must be a more consistent and profitable one. At the end of the day, any proven strategy can be profitable if the rules are followed, no matter how simple or complex.
The ABC pattern
The ABC pattern is a simple pattern that lends itself to beginner traders. The ABC pattern is also considered to be one of the more consistent trading patterns as it follows rhythmic movement. The ABC pattern provides the ability for a trader to determine risk vs reward ratio before placing the trade. The trader will decide price points where they believe the market will move from.
In order to identify an ABC pattern, find a significant high and a significant low (essentially a range). The highs and lows indicate a swing in price movement or “signal points”. The “legs” of the pattern are formed by drawing a line from A to B and B to C. Let’s have a look at an ABC pattern now.
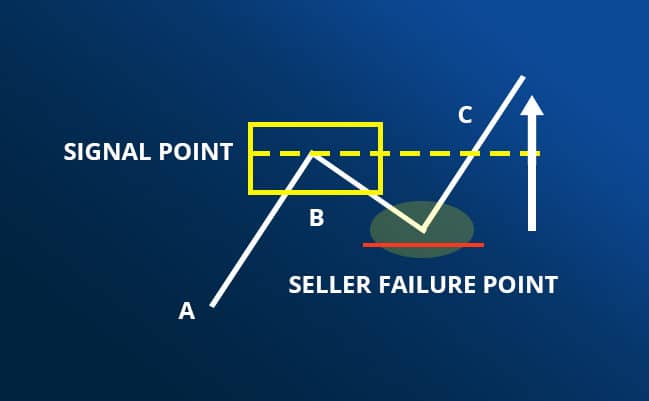
Leg A in this example indicates that buyers were able to push the price of the market up. The sellers then push back and form leg B. It is important to note that because leg B is shorter than leg A we can see that the sellers were not as strong in moving price. The swing in price (signal point) from the completion of leg B forming the start of leg C we call the failure point for the sellers.
Risk management
In this section, we will look at risk management and why it is so important to your success as a trader.
Risk management is crucial in trading, you simply can’t be profitable if you do not observe proper risk management techniques.
Risk management techniques
Risk vs reward
Risk to reward describes the level of risk (funds) that a trader puts into a trade vs the reward that they are seeking to gain. Day traders seek to always have a higher reward than the funds at risk. In doing this a Day trader is likely to have larger wins than losses and means that they can be less accurate and can still be profitable.
Risk profiling
One of the most overlooked aspects of trading for retail traders such as mums and dads is risk profiling. By risk profiling we are referring to how much of your capital you are willing to risk on any given trade in a market.
A risk profile will dictate how aggressive of conservative you intend to be, and where you set your risk limits as well as profit targets.
Industry averages suggest that you should never risk more than 2% of your trading capital on any one trade. Any more than this, we term “running the gauntlet”. You may have a victory, sure, but if you get your trading wrong, you may do significant damage to your trading account very early on in your trading which is clearly not in your interest to do.
Stop losses
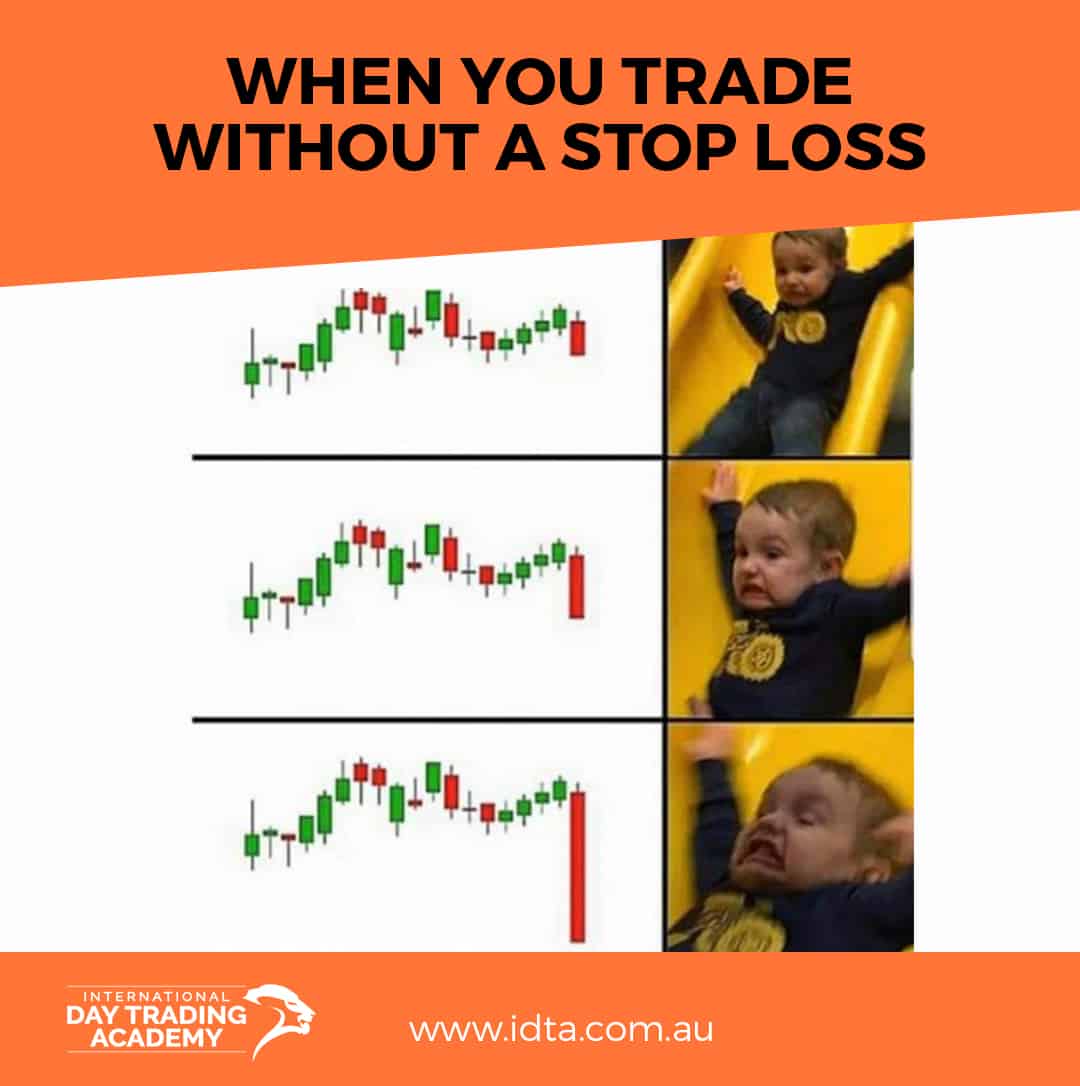
A stop loss is an essential risk management tool for any trader. A stop loss is set when placing a trade, it states a predetermined price that when triggered will exit a trade.
As the name suggests, your stop loss will stop you from losing money if the market moves against you. This helps take emotion out of trading and eliminates holding on too long to a trade that won’t be profitable.
The key function of a stop loss is to limit the size of losses, they help a trader stick to their risk limits that they set themselves.
How to learn how to trade
In this section, we will look at some Day Trading patterns that are a good starting point for beginner traders.
Trading resources
Videos:
For those that are visual learners video is typically the medium of choice. In particular, when it comes to learning a specific strategy it is useful to see that strategy in action. Many brokers now offer free video tutorials based on fundamentals, analysis, and strategy. Just be careful that they do not use this free education to romance you into using their trading platform otherwise you may get stuck trading against your broker. You should also consider the credentials of the people producing the video content.
Books:
There are many excellent trading books that you can learn to trade from. The problem with learning from a book is that there is no support structure, if you have any questions or need help, it’s not really available. Though there is nothing wrong with learning from a book, it is very much a case of you being on your own on the journey to learning how to trade.
Here are a few books that are a good starting point for beginners:
- How to Day Trade for a Living by Andrew Aziz – A highly regarded book by many, this is a good start for the complete beginner. The book covers fundamentals, strategies, and trading psychology.
Read this related article about how to day trade for a living. - High-Probability Trading by Marcel Link – A realistic look at Day Trading and what to expect. High Probability Trading provides real life examples and details a plan to become profitable.
- Trading in the Zone by Mark Douglas – This is one of the most popular and thorough guides to trading psychology. You won’t learn any technical analysis or strategy from this book, but it is a highly recommended read by many. Given that trading is 80% mental and 20% technical ability it makes a lot of sense to ensure that you master this topic.
Forums:
Forums are more likely useful for supplemental information rather than the primary source of learning. It is important to take anything read in forums with a grain of salt. Be mindful that the people who post in forums may not be professional traders and may not always be correct in what they say.
Online courses:
Online trading courses are one of the most effective ways to learn how to trade. It’s important that any online educator provides support and guidance as you learn. Our online courses are fully supported by trading mentors, trading hubs, Live Trading Rooms, and more. Also make sure these online courses also use tests of competence to benchmark your learning process as you go. This allows for you to build your knowledge stage by stage and tends to set a great foundation for profitable trading.
Trading Academies:
Of all of the methods of learning how to trade, learning through a trading academy is commonly the most in depth. At the International Day Trading Academy we have a strong focus on support. We know that it takes guidance and mentorship to get the most out of your education.
If you are going to use a trading academy, we also suggest you only use an academy that also offers a Live Trading Room. The Moderators in a Live Trading Room call your trades for you live in the market while you learn to trade their strategies. It is the ultimate test of whether a strategy works, day after day and in real time. There is no better test in my opinion.
The benefit of trading academies that offer Live Trading Rooms is they provide proof of concept and success of their strategy. Many trading academies do not run Live Trading Rooms as their strategy ultimately does not work. Worse still, some academies only teach, and do not actually trade.
Does Day Trading work?
In this section, we will look at whether trading can be made to work and be profitable. By the end of this section, you should be able to decide if learning how to trade is right for you.
How much do Day Traders make?
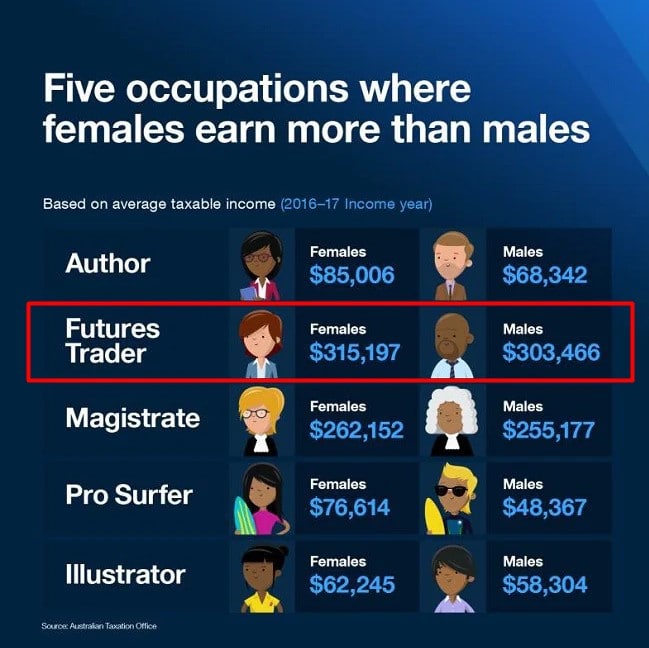
There is no definitive answer to this question because it is determined entirely on performance and starting capital. In saying this, according to the Australian Tax Office (ATO), the average taxable income of Futures traders for 2016-17 was $315,197 for females and $303,466 for males.
Futures trading is the only trading discipline that features on the list. Interestingly, Futures trading is one of the few fields where females make more than their male counterparts. Of course, not all traders are successful; it takes time, patience, and practice in order to trade well.
The success of other traders may not be indicative of your own performance.
However, on average, Futures traders are among the highest earners in the country, and female Futures traders rank number two on the list of occupations in which women earn more than men in Australia.
Does Day Trading work?
Does trading work? That depends on the lens you use to assess that question. Does Day Trading work for everybody that tries it? No, of course not. Does Day Trading work for many people? Yes, it does. Many people trade successfully and do so as a full-time job.
To day trade well, you need to follow a proven plan and stick to that plan every day. Patience and discipline are critical to your success in trading. If you are able to do these things, then you have a good chance at being a successful trader.
Could you become a Day Trader?
Ultimately, you are the only one who can answer this question for yourself. Hopefully based on the information above you have a good idea of what it takes to be successful in trading. If you’re someone who is willing to take the time to learn and practice a proven strategy, then you are in the right place.
One of the most critical success factors in trading is support during the learning process. A person can learn to trade from various sources online, however from our experience, people tend to be more successful when they have a mentor and a support system.
We devote a lot of our time and resources to ensure that all of our members feel completely supported in their trading journey. So much so, we have member run trading support hubs globally. We also run free monthly global client support webinars for any International Day Trading Academy Trader that wishes to log in and ask a question about trading.
If you’re interested in learning more about Day Trading and feel free to join us for our next web class.

