Swing Trading Strategies Introduction
Swing trading strategies are a popular method for traders to navigate the markets and profit from short-term price fluctuations. By understanding key concepts such as support and resistance levels, traders can develop effective swing trading strategies that give them an edge in the markets.
In this guide, we’ll explore various aspects of swing trading, including effective strategies.
Whether you’re a seasoned trader or a beginner, this article will equip you with the knowledge to swing trade at your best.
Let’s look at some swing trading strategies, and the tools needed to trade them.
Understanding Swing Trading
Before diving into strategies and comparisons, let’s look at what swing trading is.
Swing traders will hold open positions for days to several weeks or more. The aim is to capture short-to-medium-term price movements within broader market trends. It requires a blend of technical analysis, risk management, and patience.
The Importance of Effective Swing Trading Strategies
Effective swing trading strategies help find potential entry/exit points, and manage risk. Here are some key reasons why having a solid strategy is crucial:
Consistency:
A well-defined swing trading strategy helps maintain consistency in your trading decisions. This minimizes emotional biases and impulsive trading.
Risk Management:
Strategies enable you to define risk parameters, set stop-loss levels, and determine position sizes.
Timing Entry and Exit Points:
Swing trading strategies help identify optimal entry and exit points. A strategy will use technical indicators, patterns, and market conditions.
Adaptability:
Adjust your strategy to suit market conditions to capitalise on changing trends and volatility.
Why Pinpointing Exact Tops and Bottoms Is Challenging
Perfectly catching the absolute top or bottom of a swing is a bit like trying to hit a moving target blindfolded. Market moves are influenced by countless factors, from economic data releases to sudden shifts in investor sentiment, making each price swing unpredictable.
As a result, swing traders generally aim to capture the “heart” of a move rather than obsess over nabbing the extreme high or low. Waiting for confirmation before entering or exiting a trade is a smart way to reduce false signals—but it often means you’ll miss a small portion of the move at either end. The key is to focus on consistently capturing a meaningful part of each trend, rather than getting caught up in chasing perfection.
Key Swing Trading Strategies
To succeed in swing trading, you need a solid strategy. Here are some effective swing trading strategies used by professional swing traders:
Breakout Swing Trading Strategy:
A breakout strategy in swing trading is a popular approach. Breakouts provide significant price movements when the price breaks out of a support or resistance level.
The idea is that when the price breaks through a key level, it signifies a shift in market sentiment. This hints at the potential for a new trend to emerge.
In a breakout strategy, swing traders track price levels that act as barriers for the price movement. You can identify support and resistance in many ways, including technical analysis tools like trendlines, horizontal support/resistance, or chart patterns.
When the price surpasses these levels, it is considered a breakout.
Swing traders often wait for confirmation of the breakout. Increased trading volume and significant price movement beyond the breakout level provide confirmation.
Confirmation helps validate the strength of the breakout. This reduces the chances of false breakouts (“fakeouts”). Fakeouts occur when the price moves beyond a level but fails to sustain momentum.
Once a breakout is confirmed, swing traders may enter a trade in the direction of the breakout. It’s assumed price will continue moving in that direction and potentially return a profit.
It’s important to note that breakout strategies, like any trading strategy, carry risks. False breakouts and market reversals can occur, leading to potential losses. Thus, it’s crucial to combine breakout strategies with proper risk management techniques. Use thorough analysis to increase the likelihood of success in swing trading.
Trend Reversal Swing Trading Strategy:
A Trend Reversal Strategy in swing trading is an approach used to identify potential changes in the direction of a prevailing trend.
The goal is to enter trades at the early stages of a trend reversal. Doing this can capture price movements as the market shifts from a previous trend to a new one.
In swing trading, trends play a crucial role in identifying profitable trading opportunities. A trend reversal strategy focuses on signs that a trend is losing momentum or undergoing a significant shift.
Traders aim to enter trades in anticipation of the new trend, and capitalize on the subsequent price movements.
Trend reversal strategies often use various technical analysis tools and indicators. Some commonly used indicators include moving averages, trendlines, and candlestick patterns. These indicators help traders identify potential reversal signals and confirm the formation of a new trend.
Trend reversals need careful analysis and confirmation to increase the probability of success. False signals and market volatility can occur, leading to potential losses.
Traders should combine trend reversal strategies with proper risk management techniques. Consider multiple indicators or tools to strengthen decision-making process in swing trading.
Pullback Swing Trading Strategy:
A pullback strategy takes advantage of temporary price retracements within an established trend.
Trends don’t move in a straight line, they experience temporary pullbacks before resuming. Identifying these pullbacks, swing traders aim to profit from the resumption of the dominant trend.
The key concept behind a pullback strategy is to enter during these temporary price corrections. With the assumption that the overall trend will continue.
To identify potential pullbacks, traders use tools such as trendlines, moving averages, etc.
When implementing a pullback strategy, swing traders wait for the price to retrace to a key level within a trend. This retracement level serves as a potential entry point.
The idea is to enter the trade when the price reaches the support/resistance level and shows signs of resuming the trend.
To manage risk, traders usually set stop-loss orders below the support or resistance level. This is to limit potential losses in case the pullback extends into a trend reversal. Profit targets are often set at previous swing highs or other resistance levels within the trend.
Pullback strategies need careful analysis and consideration of the overall market context. Not all retracements lead to trend continuations, and some pullbacks may result in trend reversals. Thus, it’s crucial to combine a pullback strategy with other indicators, and risk management techniques.
Moving Average Crossover Swing Trading Strategy:
A Moving Average Crossover Strategy is a popular swing trading technique. Intersection of different moving averages help identify potential reversals or continuations.
This strategy helps traders identify entry and exit points based on the relationship between two or more moving averages .
Traders often use two moving averages with different time periods. The 50-day moving average and the 200-day moving average being the most common. But, traders can adjust the time periods based on their trading style and the specific market they are trading.
When the shorter-term (50) moving average crosses above the longer-term (200) moving average, it generates a bullish signal. The cross over indicates a potential upward trend known as a bullish crossover.
When the shorter-term moving average crosses below the longer-term, it generates a bearish signal. The cross over indicates a potential downward trend known as a bearish crossover.
You can confirm the crossover by observing increased trading volume or by using technical indicators. Confirmation helps reduce false signals and increases the reliability of the strategy.
Support and resistance levels, or chart patterns, can further confirm the trade and find optimal entry and exit points.
The Moving Average Crossover is a lagging indicator, meaning it responds to past price data. Thus, it may not always capture the exact turning points of a trend. Consider other indicators and risk management techniques to further refine your trading decisions.
Like any trading strategy, traders should thoroughly test before implementing it in live trading.
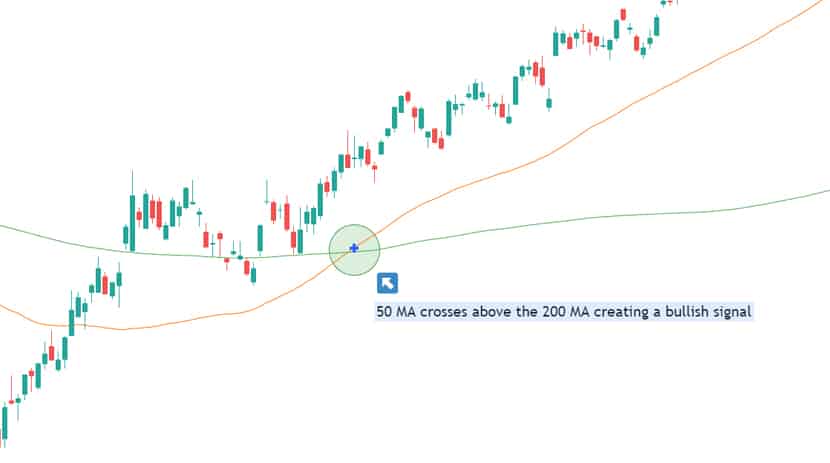
Chart from Tradingview.com
Fibonacci Retracement Swing Trading Strategy:
A Fib retracement strategy in swing trading uses Fibonacci ratios to identify potential levels of support and resistance. This strategy is based on the Fibonacci sequence, a mathematical sequence where each number is the sum of the two preceding numbers (e.g., 0, 1, 1, 2, 3, 5, 8, 13, etc.).
Fibonacci retracement levels are plotted on a chart to identify potential areas where the price may reverse or continue a trend.
The most common Fibonacci retracement levels are 38.2%, 50%, and 61.8%, although levels like 23.6% and 78.6% can also be considered.
First identify a significant price move, either an upward or downward trend, that you want to analyse. They then draw the Fibonacci retracement levels by connecting the high and low points of the trend.
The key Fibonacci retracement levels act as potential support (if in an uptrend) or resistance (if in a downward trend). Swing traders look for price reactions near these levels, such as price bounces or breaks, to make trading decisions.
If the price retraces to the 50% Fib retracement level in an uptrend, traders may consider this level a potential buying opportunity. If the price reaches the 61.8% retracement during a downtrend it is showing signs of a reversal. Swing traders may consider entering a short position.
For added confirmation, use Fibonacci levels along with other tools. Tools can include trendlines, moving averages, candlestick patterns.
Trendline Swing Trading Strategy:
A trendline strategy in swing trading involves drawing lines on a price chart to identify market trends.
To draw trendlines, connect consecutive higher lows in an uptrend or lower highs in a downtrend. This creates a visual representation of the prevailing market direction.
The trendline strategy helps swing traders pick entries and exits based on either respecting or breaking the line.
Swing traders may look to enter long positions when the price pulls back and touches the trendline. This provides a potential entry point with the expectation that the uptrend will continue.
In a downtrend, draw a trendline by connecting two or more lower highs. Swing traders may seek short-selling opportunities when price rallies and touches the trendline. This offers a potential entry point with the anticipation that the downtrend will persist.
Furthermore, trendlines can also act as dynamic support or resistance levels. When the price moves above or below a trendline, it indicates a potential trend reversal or continuation. Swing traders may use these breakouts or bounces off trendlines as signals to enter or exit positions.
Trendlines should be regularly reviewed and adjusted as market dynamics change over time.
Candlestick Patterns Swing Trading Strategy:
A candlestick pattern strategy involves analysing patterns created by candlestick charts. Candlestick charts provide visual representations of price movements over time. Candles and candlestick patterns can offer insights into market sentiment.
Candlestick patterns are formed by the open, high, low, and close prices of a trading period (e.g. a day, a week, or an hour). These patterns can indicate shifts in market sentiment. This provides signals for potential entry or exit points in swing trading.
Some commonly used candlestick patterns in swing trading include:
Engulfing Patterns:
These patterns occur when a larger candle completely engulfs the previous smaller candle. Engulfing patterns indicate a potential trend reversal.
Bullish engulfing patterns occur at the bottom of a downtrend, suggesting a potential upward move. Bearish engulfing patterns occur at the top of an uptrend, indicating a potential downward move.
Doji:
A doji is a candlestick with a small real body, indicating indecision between buyers and sellers. A doji can suggest a potential trend reversal when it appears after a strong uptrend or downtrend.
Hammer and Hanging Man:
These patterns have long lower shadows and small real bodies. A hammer occurs at the bottom of a downtrend, suggesting a potential trend reversal to the upside.
A hanging man occurs at the top of an uptrend, indicating a potential trend reversal to the downside.
Morning Star and Evening Star:
These three-candlestick patterns typically indicate trend reversals. The morning star pattern appears during a downtrend; it consists of a long bearish candle, then a small-bodied candle, then a long bull candle. The evening star pattern appears during an uptrend and has the opposite structure.
Traders often combine these patterns with indicators and tools to confirm trading decisions.
Swing Trade Strategies: Indicator Examples
Swing traders can use several indicators in their strategy. Common indicators include moving averages, momentum indicators, volume indicators, and more.
Momentum indicators:
A momentum indicator shows the strength of weakness of an asset at its current price. One example would be the Relative Strength Index (RSI) which shows if the asset is over-bought or over-sold.

Moving Averages:
Simply put swing traders use moving averages to smooth out market data and provide an average price. If the moving average rises, there is an uptrend, if it falls there is a downtrend.

Volume Indicators:
An example of a volume indicator is the On-Balance Volume (OBV) indicator. This indicator essentially shows the trader the changes in volume (trades being made/held). This kind of herd mentality can help in indicating a trend, or some level of strength.

If you’re interested in trading indicators, check out our best indicators for day trading.
Why Your Own Analysis Matters
While trading signals can offer handy cues for when to jump in or out of a swing trade, relying on them alone can leave you flying blind. Developing your own analysis skills is essential for several reasons:
- Understanding the “Why”: Automated signals may tell you what’s happening, but building your own skills helps you understand why price moves—so you’re not just following instructions but making informed decisions.
- Adapting to Market Twists: Markets are dynamic. A signal algorithm can miss changes in volatility or shifts caused by unexpected news. If you know how to read charts and trends yourself, you can pivot your strategy on the fly.
- Avoiding Over-Reliance: No system is perfect. Relying exclusively on signals can lead to missed opportunities or trades made on faulty analysis.
- Building Confidence: When you’ve done your own homework and make decisions based on your own observations, you’re more confident in your trades, less likely to panic, and better equipped to fine-tune your approach.
Trading signals are helpful, but your personal analysis is what turns a good trade into a great one.
Swing Charts Swing Trading Strategy
Swing charts can be incredibly useful for traders aiming to quickly assess market strength and pinpoint trend direction. Unlike traditional bar charts, swing charts cut through the market “noise,” making it easier to recognize the essential features of price movement.
When analyzing a swing chart, traders focus on:
- Peaks and troughs (highs and lows)
- Key support and resistance levels
- Clear chart patterns that may signal future price action
- The overall strength of a stock’s move
A well-constructed swing chart covers broad market history while remaining readable, some traders prefer looking at several years’ worth of data to spot long-term trends. Marking horizontal lines for support and resistance makes these inflection points instantly visible, while retracement levels (such as the 50% line) help gauge the strength of each new move.
Identifying Trend Strength and Reversals
Suppose you notice on your swing chart that, after a notable low, the stock consistently prints higher highs and higher lows. This pattern is a classic sign of an emerging uptrend. If, during a pullback, the price doesn’t retrace more than half of the previous upswing before bouncing back, it typically suggests that buyers remain in control which is an encouraging sign for bullish traders.
A powerful confirmation occurs when price action breaks above a well-defined downtrend line and closes above it on multiple timeframes. This, combined with higher swing lows and limited retracement, can confirm a robust uptrend and signal a potential entry. Such setups are often considered lower-risk because several pieces of evidence point in the same direction.
By revisiting and updating swing charts as new price action unfolds, traders can maintain a clear perspective on whether the market’s momentum is holding or starting to wane. This clarity supports confident decision-making, both when jumping into a new position and when locking in profits.
Swing Trade Strategies: Pattern Examples
There are two main types of swing trades; they are reversals and continuations (sometimes called momentum or breakouts).
There are many stock chart patterns that you can use in your swing trade strategy. Here are a few popular trading patterns.
Swing Trading in Uptrends and Downtrends
Let’s break down how swing trading looks in action in market’s moving both up or down.
When stocks are climbing (an uptrend), traders hunt for buying opportunities at price dips reaching a “swing” from low points back up to new highs. For instance, if Apple’s price pulls back after a strong rally but stays above its recent support level, a swing trader might step in, aiming to ride the next upward move.
On the flip side, when the market is sliding (a downtrend), swing traders pivot: now, the strategy is to sell short from price peaks, targeting moves down to new lows. Imagine Tesla topping out after a brief bounce in a generally weak market. Here, a swing trader would look to initiate a short position as the price rolls over, capturing profit as the stock resumes its decline.
Whether you’re riding the waves up or down, the basic principle is the same: identify the swing points and capitalize on those major trend movements.
Ascending and Descending Triangle Patterns
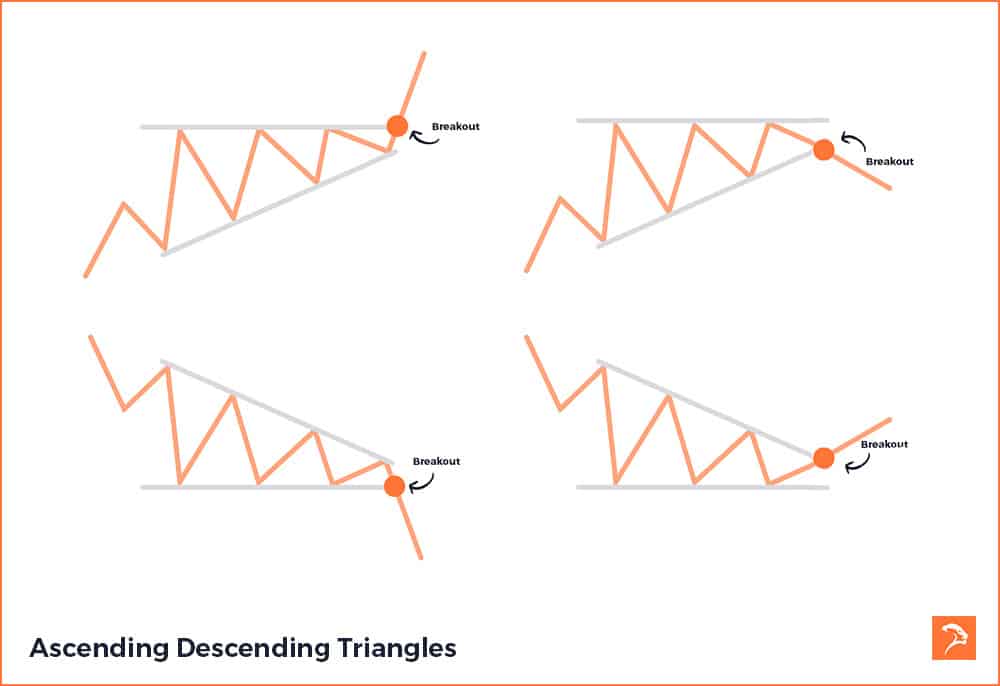
Triangles in general can be bilateral, meaning they can be a continuation or a reversal. The direction depends on which levels sees a breakout.
An ascending triangle forms off of a trend up, that moves toward a strong resistance level. The top of the triangle is a straight line along this resistance level.
The angled side of the triangle is formed by a trend line underneath the higher lows. These are considered support levels.
Ascending triangles seem to break out to continue the trend more often, however they can also break support and reverse the trend.
Descending triangles are the same concept in reverse. They for after a downtrend, the base of the triangle is a strong support level. The angled side is formed by a trend line along the lower highs.
If support breaks, the trade is a continuation down. If resistance breaks there is a reversal to the high side.
Below are examples of ascending and descending trading patterns.
Wedge Patterns
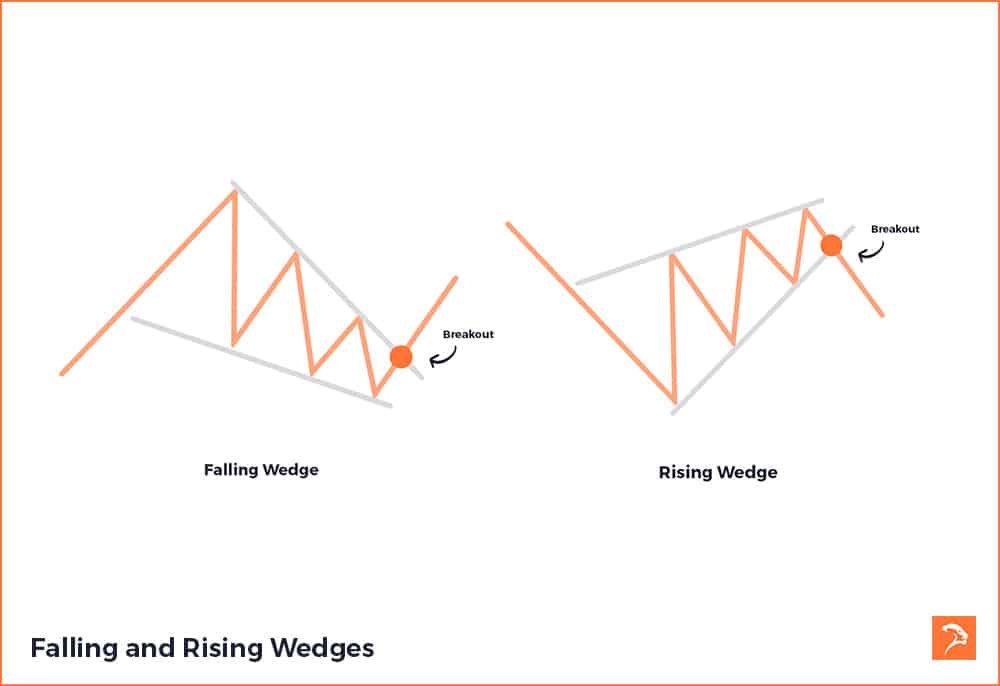
There are two types of wedge pattern, one is bullish (buying opportunity) and the other bearish (selling opportunity). These patterns are an example of a continuation pattern.
Wedge patterns form after a strong trend, either up or down. The highs and lows create trend lines which converge on one and other.
A rising wedge pattern is an example of a continuation of a downward trend. A falling wedge is an example of a continuation of an upward trend.
Below are examples of wedge patterns
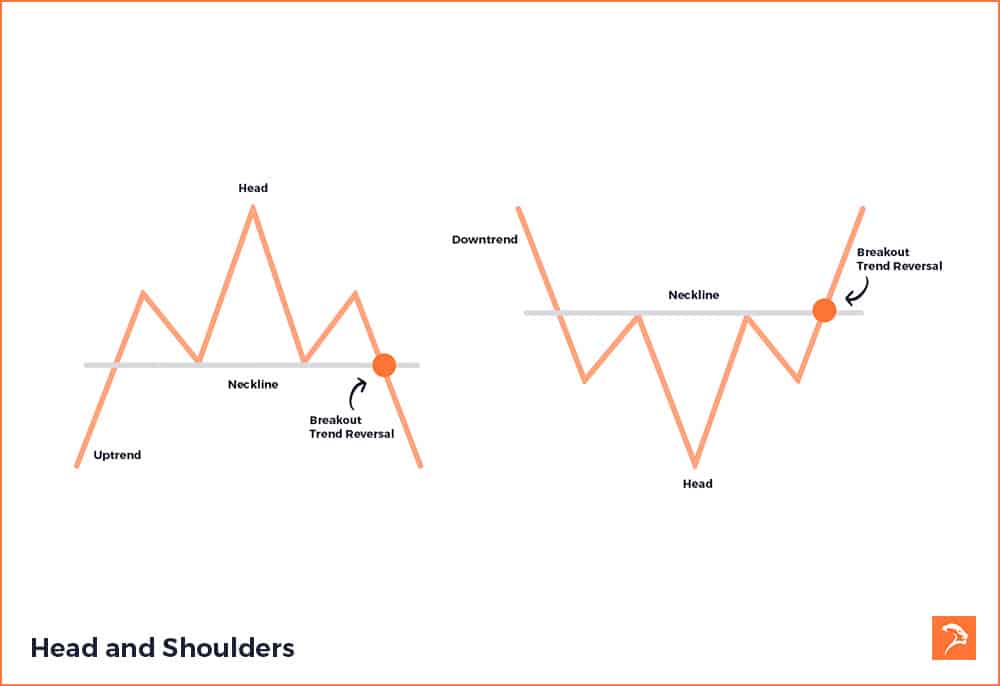
Head and Shoulders
Head and shoulders patterns indicate a trend change and can be considered a reversal pattern.
A head and shoulders pattern form a peak (left shoulder) followed by a higher peak (head), then another peak (right shoulder). The peaks that form the left and right shoulders are of a relatively similar height.
The lows between each should and the head form the ‘neckline’. When price breaks below the neckline the pattern completes which indicates a selling opportunity.
The inverse head and shoulders pattern is the bullish variant that implies a buying opportunity.
Below are examples of a head and shoulders, and inverse head and shoulders pattern
Double Top and Double Bottom
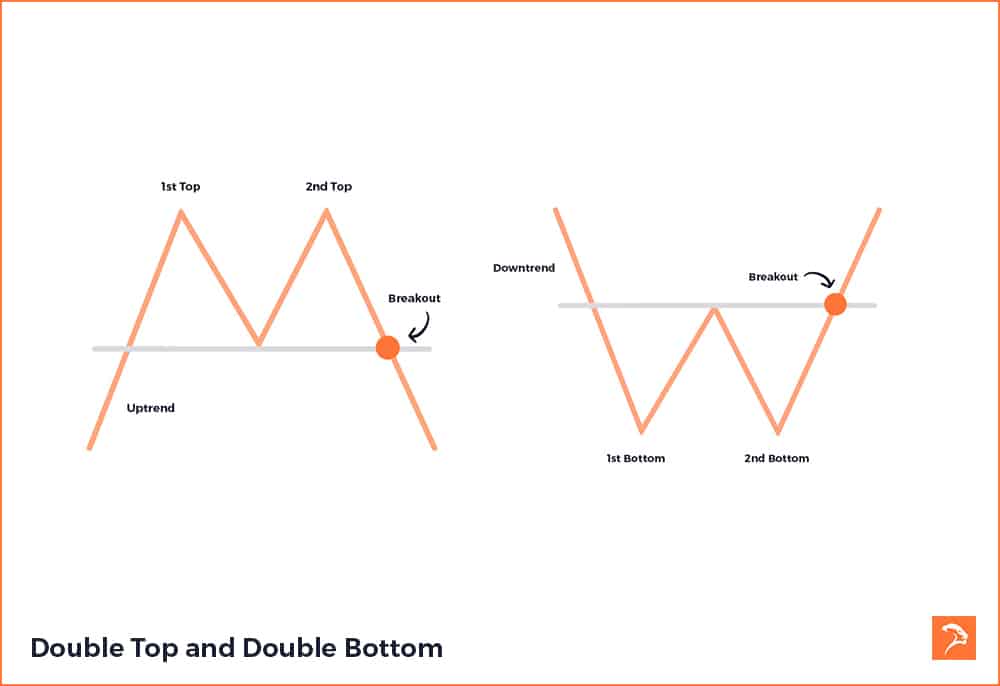
Double tops and double bottoms are examples of reversal patterns. Price will reject off of a support or resistance level, retrace, then reverse again. This indicates that a trend change may be imminent.
Below are examples of a double top, and double bottom.
Importance of Effective Swing Trading Strategies
Effective swing trading strategies provide a structured approach to identify potential entry and exit points, manage risk, and maximize profits. Here are some key reasons why having a solid strategy is crucial:
- Consistency: A well-defined swing trading strategy helps maintain consistency in your trading decisions, minimizing emotional biases and impulsive trading.
- Risk Management: Strategies enable you to define risk parameters, set stop-loss levels, and determine position sizes to manage risk effectively.
- Timing Entry and Exit Points: Swing trading strategies help you identify optimal entry and exit points based on technical indicators, patterns, and market conditions.
- Adaptability: Strategies can be adjusted to suit different market environments, allowing you to capitalize on changing trends and volatility.
It’s important to recognize that consistently predicting exact turning points is nearly impossible. Instead, swing traders focus on capturing a meaningful portion of the move, often waiting for confirmation that a new swing is underway before entering a trade.
Risk Management in Swing Trading
Implementing effective risk management techniques is crucial if you’re learning how to trade a swing trading strategy.
Here are some essential risk management strategies:
Set Stop-Loss Orders:
Determine predetermined levels where you will exit a trade to limit potential losses.
Position Sizing:
Calculate the appropriate position size based on your risk tolerance and the specific trade setup.
Diversification:
Avoid overconcentration in a single trade or asset class. Diversify your portfolio to spread risk.
Regularly Review and Adjust:
Continuously monitor and review your trades, adjusting your risk management strategies as needed.
Testing and Refining Your Strategies
Testing and refining your swing trading strategies is essential to ensure their effectiveness. Consider the following steps:
Back testing: Use historical data to simulate trades and test the performance of your strategies.
Paper Trading: Practice your strategies in a simulated trading environment without risking real money.
Analyse Results: Assess your performance based on key metrics such as win rate, risk-reward ratio, and overall profitability.
Continual Improvement: Identify areas for improvement and make adjustments to your strategies based on your analysis.
Your Swing Trading Strategy
It’s not enough to just have the tools for finding trades in your trading strategy. Your strategy also needs to contain a trading plan.
You trading plan will help you in understanding how you will manage your risk, and how exactly you will go about managing your trades.
Also consider a trading journal to document what is working in your trading strategy and what isn’t. You can download our free day trading journal to get you started.
Make sure a trading plan is part of your trading strategy.
Key Rules for Your Swing Trading Plan
To give your swing trading plan more structure, consider including some essential rules around trade direction and timing:
- Align With the Trend:
When trading over several days (short-term), make sure both your daily and weekly swing charts are pointing in the direction you want to trade. This simple check can help you avoid jumping into trades that go against the prevailing trend. - Medium to Long-Term Trades:
If you’re holding positions for weeks or months, rely on the weekly and monthly swing charts for directional confirmation. Sticking to this rule can help reduce unnecessary risk and keep your trades aligned with market momentum. - Patience Pays Off:
There may be times when your swing chart keeps you out of a trade, even though the price is moving in your favor. This can be frustrating, but trust in your plan—waiting for proper alignment can help you avoid losing trades and improve your long-term results.
By building these rules into your swing trading plan, you’ll help set clear boundaries for your trades and reinforce the discipline needed for consistent swing trading success.
Not sure where to start? Download a free trading plan template.
Benefits of Swing Trading
Swing trading offers several benefits for traders:
Flexibility: Swing trading allows for a more relaxed approach compared to day trading, as positions are held for days to weeks.
Potential for Higher Returns: Capturing medium-term price movements, swing traders have the potential to achieve higher returns than long-term investing.
Balancing Risk and Reward: Swing trading enables traders to strike a balance between risk and reward. Swing traders can trade the markets in both directions and have tools to limit losses.
Adaptability: Swing trading strategies can be adjusted to suit different market conditions, making it a versatile approach.
Swing Trading Strategies Bottom Line
Swing trading strategies can be highly effective in beating the markets. By identifying support and resistance levels, utilising candlestick patterns, and using technical tools, traders gain insight into potential entries and exits.
Risk management plays a vital role in swing trading success. Implementing stop-loss orders, calculating appropriate position sizes, and regularly reviewing and adjusting risk management strategies are essential for long-term profitability.
Testing and refining strategies is key to ensuring their effectiveness. Back testing using historical data, practicing in simulated trading environments through paper trading, analyzing results based on key metrics, and continually improving strategies based on analysis are necessary steps for success.
Having a solid trading plan that includes risk management techniques is crucial. Additionally, maintaining a trading journal to document what works and what doesn’t will help in adapting the strategy over time. Consider a trader course to sufficiently learn these skills.
Swing trading offers several advantages such as flexibility, potential for higher returns compared to long-term investing, balancing risk and reward, as well as adaptability to different market conditions. With dedication and discipline, traders can utilise swing trading strategies to navigate the markets with confidence.
If you’re interested in learning how to day trade futures, you might consider taking one of our trading courses for beginners.


