Momentum Trading Strategy Introduction
When it comes to investing, momentum trading strategies present a unique opportunity to leverage the markets. This form of trading relies on the momentum indicators or patterns to gauge the strength of the current market trend. This is to determine whether the asset is likely to continue in the same direction or reverse.
By understanding the nuances of momentum trading, you can use the momentum to your advantage. This allows you to take advantage of the price movements in the market. In this article, we’ll explore momentum trading strategies, and the best practices for employing a momentum trading strategy.
What is a Momentum Trading Strategy
Momentum trading is a strategy that involves buying and selling securities based on their recent price changes. It’s based on the belief that price can be predicted by identifying the relative strength of a financial instrument.
A trader will then use this as the basis for entering and exiting a momentum trade.
Momentum traders look for assets that have been trending up or down in price over the past hours, days or weeks depending on the time frame being traded. They then open positions based on their price direction prediction.
It’s important for traders to understand market sentiment to identify potential movements.
Benefits of Momentum Trading Strategies
Momentum trading has grown in popularity in recent years due to its many benefits. It’s a style of trading that focuses on exploiting market moves that start in one direction and are expected to continue in that same direction.
It’s an effective way for traders to capitalize on short-term trends and take advantage of rapid increases or decreases in price.
This type of trading can potentially generate higher returns due to the speed at which trades can be executed.
Indicators For Trading Momentum
Momentum trading indicators play a crucial role in a momentum trading strategy. These indicators help traders identify market trends by using market data.
These indicators are mathematical calculations that measure the strength of price movements. They can be used to confirm the presence of a trend or to spot potential reversals.
What is a Momentum Indicator
There are various types of momentum indicators available to traders. Some of these include Moving Average Convergence Divergence (MACD), Relative Strength Index (RSI), and Stochastic Oscillator. Each indicator has its own unique formula and interpretation, but they all aim to provide insights into market momentum.
Using these indicators as well as price charts, traders can gain a better understanding of the current market trend.
It’s important to note that no single indicator should be relied upon solely. Different indicators may give conflicting signals. Thus, it’s advisable to use multiple indicators in conjunction with other technical analysis tools. This will help you in making more accurate predictions.
Key Points to Note for Identifying Market Trends
Identifying stock market trends is a crucial aspect of momentum trading strategies. There are several key points to note when identifying stock market trends.
Use a handful of indicators in conjunction with each other (don’t over do it). You want to have enough statistical information to make high-probability decisions.
Stay updated on market sentiment and news events can also aid in identifying stock market trends. Understanding how external factors influence price can provide valuable context for decision making.
Understand at least one or two momentum-based trading patterns. These patterns will allow you to identify probable areas for potential momentum.
Momentum Trading Strategies
To identify trades that could experience significant price movement, you need to understand common characteristics of momentum trades.
Before delving further, it’s important to consider what we expect from a momentum day trading strategy. Firstly, we need assets that already exhibit movement. Assets that move sideways are not useful for our purposes.
Hence, the initial step for a trader is to locate assets that are experiencing movement. Stock traders will use stock scanners to achieve this. Traders looking at other products, like Futures or Currencies have fewer options, so scanners aren’t required.
There are two main things to consider;
- Does the asset display strength? Is price higher than the Moving Averages? and is it clear of any nearby resistance?
- Is there higher than average volume (we call this relative volume). Relative volume is todays price vs the average price for the current time of day. Twice as much relative volume is a good minimum level.
Momentum Day Trading Strategies
Momentum day trading strategies often include chart patterns. There are a number of momentum-based chart patterns (often called ‘breakouts’).
Some of the simplest patterns (I find) are flag patterns, and triangle patterns. These patterns happen quite often and are reasonably easy to spot on a chart with a little practise.
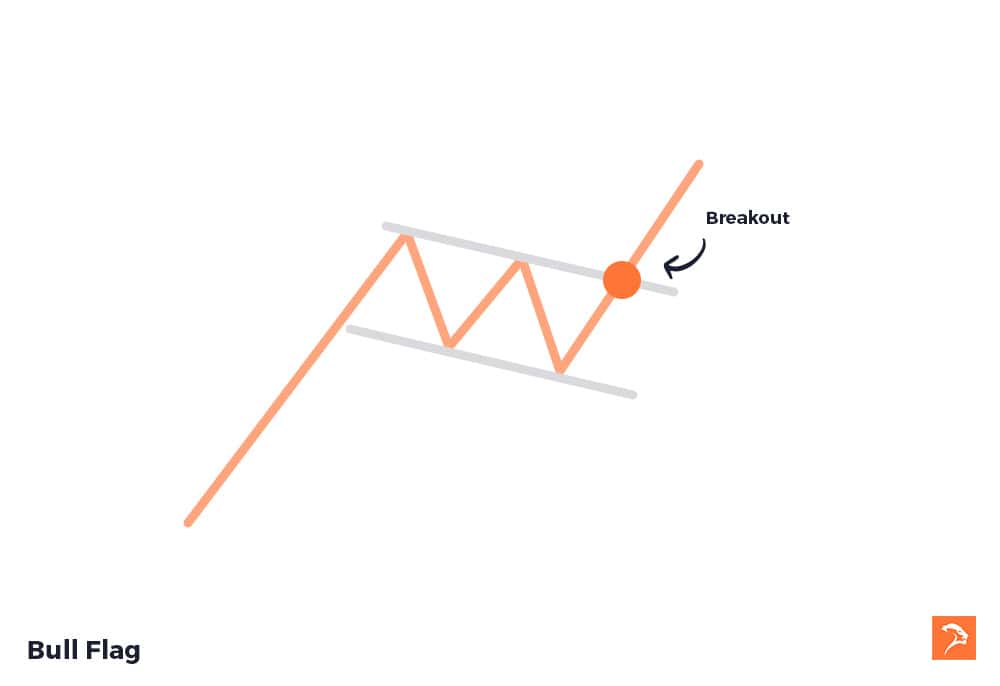
Flag patterns form after a sharp trend up or down is followed by a slight retracement, or pullback. If the position is long i.e. trending up, the the tops of the candle wicks form the resistance level. Once price then makes a higher high, or even better, ones price brakes above the line of resistance, there is momentum.
What I like about flag patterns is that price often can trade the entire ‘flagpole’ that is, the initial trend.

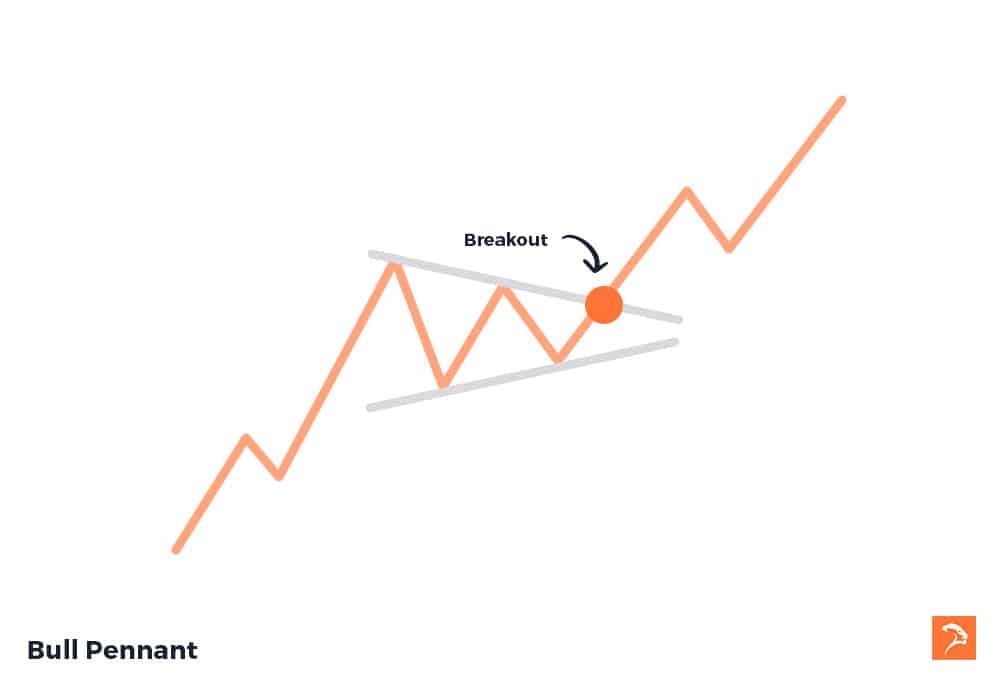
Another flag pattern, somewhat similar to the Bull Flag, is the Pennant. Like the Bull Flag, a pennant forms after a strong trend halts. A Pennant flag will show lower highs and higher lows forming a triangle shape.
You can see that in each of these patterns that the trend continues after resistance is broken, other traders begin to join in and create momentum.
Read more about day trading Australia.

When to Employ Your Momentum Trading Strategy
The best time to trade this strategy is when there is a lot of volume in the market, because that is what typically moves price. So when is there more volume in the market?
Most traders sit down to trade at the open of each major trading session. The best time for higher volume is in the first hour of a session.
Some traders will also look at trading the final hour of a session, though the first hour is often best. Not only should you consider the best time of day, you should also choose major markets to ensure there is plenty of volume.
Bottom Line
Momentum trading strategies can be a powerful tool for traders looking to capitalise on short-term trends. Understanding chart patterns and using momentum indicators, can increase your chances of success.
It’s important to note that no single indicator should be relied upon. Using multiple indicators with other technical analysis tools allows for more accurate predictions.
Staying updated on market sentiment and news events are also crucial factors in identifying market trends.
Lastly, traders should employ their strategy during periods of high volume in the market. This is often the first hour of a major trading session.
Using these guidelines, traders can take advantage of a momentum trading strategy. This can allow them to potentially achieve higher returns from their investments.
If you want to know how to get started trading, or want to know more about our professional trading strategy, consider taking a free trading class today.
Momentum Trading Strategy FAQs


