What is Price Action Trading?
So, what is price action trading exactly? Price action trading refers to the movement of a security’s price over time. It’s a method of predicting future price movements based on the historical price data.
A price action trader uses only information involving price history to make trading decisions.
By studying these trading patterns, traders can identify trends, support and resistance levels, and potential entry and exit points. Price action trading is favoured by many traders because it eliminates the need for complex indicators or other external factors. Solely trading price action allows traders to focus only.
Trading price action is all about understanding the language of the market. As a trader, you must learn to decipher the messages that price movements convey.
Trading Price Action
Price action trading requires patience, discipline, and a deep understanding of market dynamics. It can be an effective way to interpret market sentiment and make informed trading decisions based on pure price movement.
In the world of trading, price action is like a language that communicates the sentiments and movements of the market. It allows traders to navigate through the complex world of finance with simplicity and precision.
A price action strategy should include a method to find high-probability trades, but also to manage risk. Part of a price action strategy is to use tools such as stop loss orders to manage risk.
Strategies For Price Action Trading
There are several methods that traders use to trade price action.
Here are some of methods of price action analysis:
Support and Resistance
One common method used in price action trading is identifying key support and resistance levels on a price chart.
Support levels are areas where the price has historically found strong buying interest, causing it to bounce back up.
Resistance levels, on the other hand, are areas where selling pressure has historically been strong, causing the price to reverse its upward movement. Traders can use these levels as potential entry or exit points for their trades.
Support and resistance can be formed via gaps in price, candlesticks, patterns, and even psychological numbers. Support and resistance levels can be considered as the backbone of all price action trading. Each of the following are methods for identifying these levels.
Trend Trading
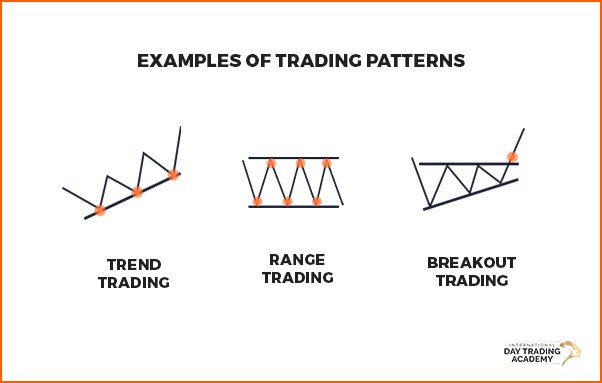
Trend trading is another popular method used in price action trading. Traders who follow this approach try to identify and trade along with the dominant trend in the market.
By analysing the highs and lows of price movements, traders can determine whether the market is trending upwards, downwards, or moving sideways.
In trend trading, traders aim to enter a trade when the market is in an established trend and exit when there are signs of a reversal. This method allows traders to capture larger price movements and potentially maximize their profits.
An uptrend is identified by higher highs and higher lows. This means that the market is clearly moving in an upward direction. A downtrend is defined as a prolonged string of lower highs and lower lows.
Breakouts
There are 2 important levels in trading, support and resistance.
A breakout occurs when price breaks above resistance, or below support. If price breaks above resistance a trader might look to take a long position. Should price break below support, a trader would consider this as a potential selling opportunity.
A breakout of either of these levels suggests that a trend could be forming, either up or down. If price breaks resistance, it may trend up, if support is broken there may be a downtrend.
Breakouts can often be accompanied by higher volume this is considered to be a momentum trade. This happens when a great number of market participants identify the breakout and seek to profit from it.
Not all breakouts continue on to form a resulting trend. There is a term for trades that breakout but fail reasonably quickly, which is a ‘fakeout’. This can sometimes result in a complete reversal of direction in price.
Reversals
Simply put, a reversal in trading is the change in the direction of price movement. Reversals occur after an overall trend in the market meets some form of resistance and then moves in the opposite direction. A reversal from an uptrend would reverse into a downtrend, a reversal of a downtrend would reverse upward.
Reversals are popular with swing traders who want to take advantage of larger movements. A swing trader would look to use a reversal as a way of capturing a newly forming trend and hold that position.
It is only considered a reversal if the direction of the trend changes. Price moves off support and resistance levels frequently, a reversal is a more meaningful change in direction.
A less meaningful change in price direction is considered a ‘pullback’ which can look a lot like the beginnings of a reversal. The difference is that a pullback is a form of consolidation that will result in price then continuing the current overall trend.
Candlesticks Analysis
Candlestick analysis is a highly effective method for trading price movement. This approach involves studying the patterns and formations created by candlestick charts to identify potential market reversals or continuations.
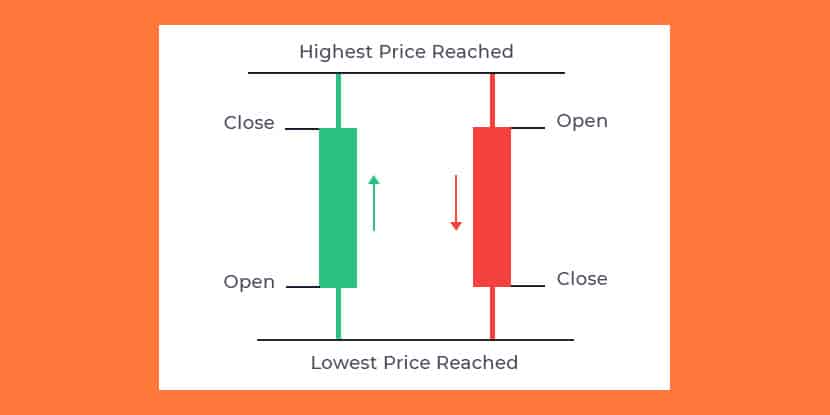
Each candlestick represents a specific time period and displays the opening, closing, high, and low prices during that period. Traders analyse the shape, size, and position of these candlesticks to gain insights into market sentiment and potential price movements.
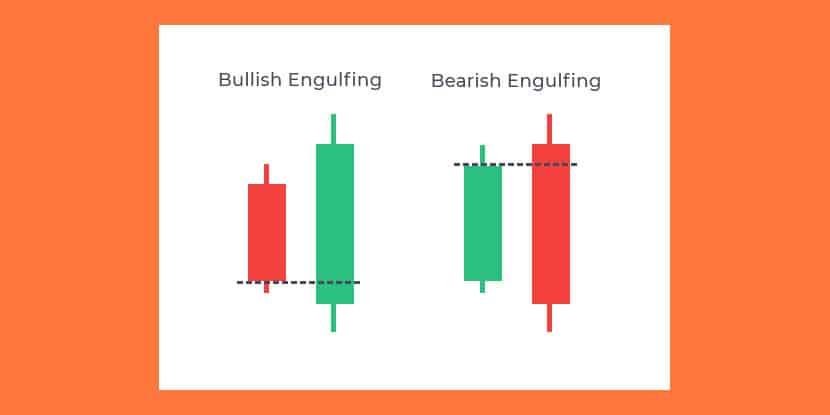
For example, a bullish engulfing pattern, where a small bearish candle is followed by a larger bullish candle that engulfs it, indicates a potential trend reversal from bearish to bullish.
On the other hand, a bearish engulfing pattern signals a potential reversal from bullish to bearish. Traders also pay attention to doji patterns, hammer patterns, and shooting star patterns, among others, for further confirmation of market sentiment.
Knowing how to read candlestick charts is a powerful skill for any trader to possess.
Price Action Patterns
Trading patterns are another important aspect of price action trading. These patterns are formed by the repeated behaviour of market participants and can provide valuable insights into future price movements. Trading these types of patterns is one many popular forms of technical analysis.
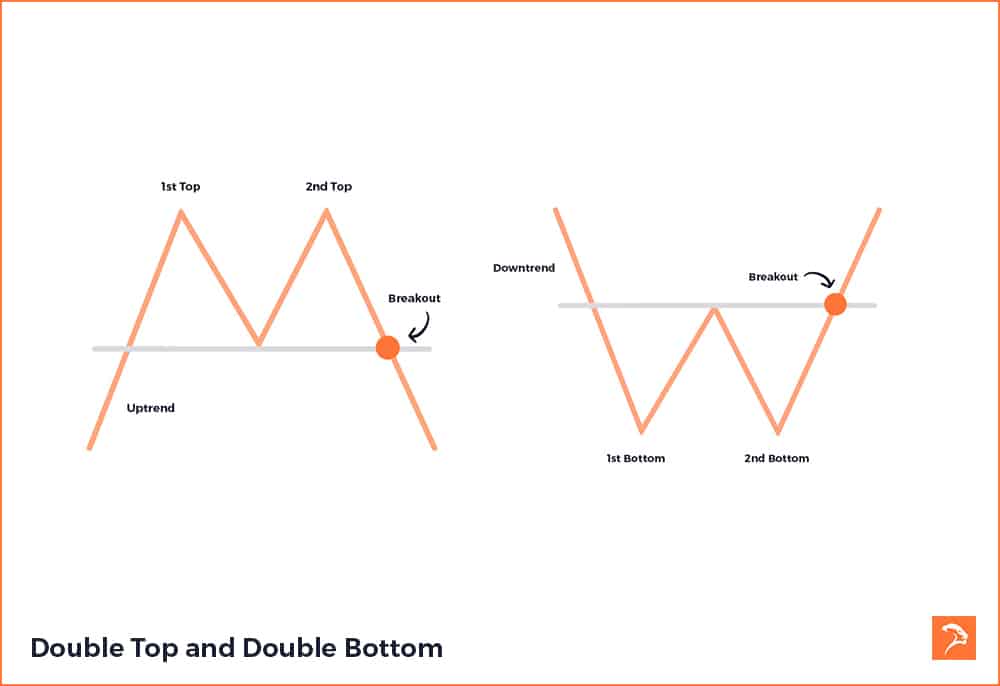
One common trading pattern is the double top or double bottom pattern. This occurs when price reaches a certain level, pulls back, and then returns to that level again before reversing. Traders often interpret this as a sign that the previous trend is losing strength and a reversal may be imminent. Think of the second top or bottom as confirmation that there may be an area of support or resistance.
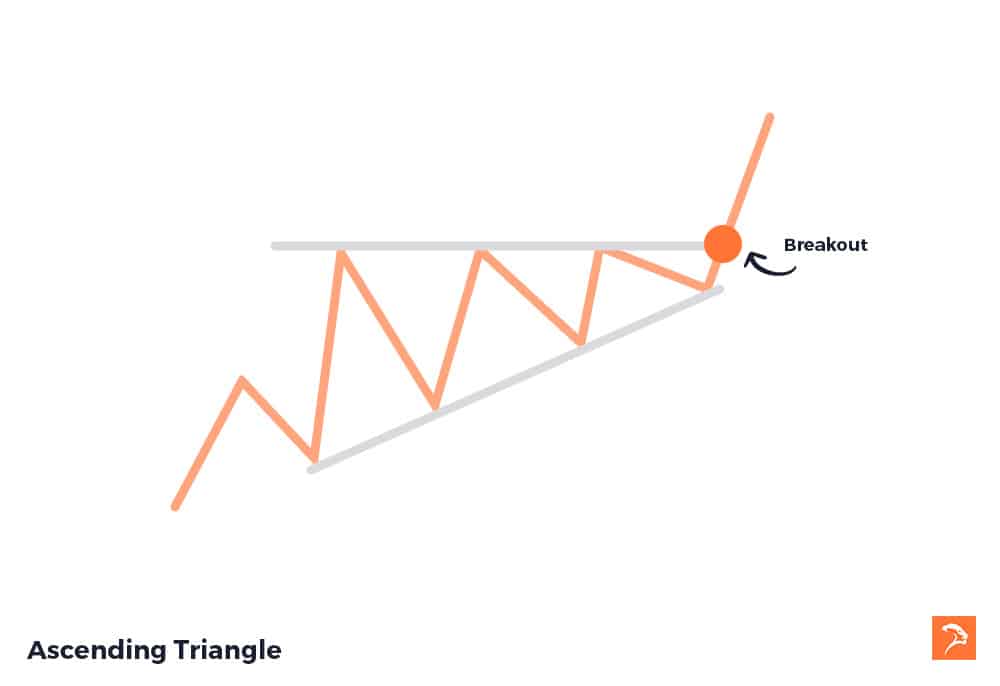
Another popular pattern is the ascending triangle pattern. An ascending triangle pattern is used to identify breakouts, or a breaking resistance. This pattern forms after trend upward breaks above a key resistance level. With the resistance level broken, price is no longer tethered and can potentially run to the next level of resistance.
Helpful Tools
Although trading price action doesn’t strictly require additional tools, they can be useful. Trading platforms all have built in features that can assist traders in identifying market sentiment, or marking up the above-mentioned methods. Some of the most commonly used tools are indicators, and drawing tools.
Technical Indicators
Trading price action doesn’t strictly involve the use of trading indicators, but they can be a valuable addition. Neither patterns, nor indicators are perfect, and sometimes one adds missing context. Indicators are a trading platforms tool for visualising complex data. This can include current volume, relative strength, moving averages, and more.
It’s a good idea to add a few trading indicators to your charts as a way of ‘confirming’ any movements that you’ve identified using your price action strategy.
Using Drawing Tools in Your Price Action Strategy
Any decent trading platform provides various drawing tools to mark-up price movement on your charts. These tools can be used to visualise things like support and resistance, trendlines, and to draw patterns.
While seasoned traders can identify these forms of pure price movement, using drawing tools is useful for beginners.
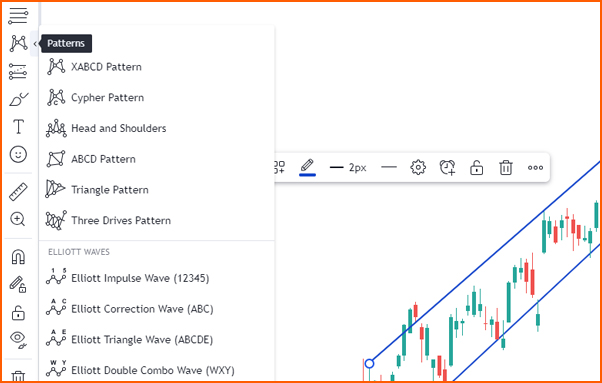
Example of price action drawing tools in tradingview
How to Backtest Price Action Strategies
It’s important to backtest price action trading strategies to validate performance. You shouldn’t employ a trading strategy without having tested whether it works.
Using your trading platform, review historical data and apply the strategy. Most trading platforms offer market replay functions, for this. This will allow you to trade without risking capital. Continue this process until your sample size is large enough to prove effectiveness.
It’s also important to forward test your trading strategy. Again, most trading platforms provide simulated trading, otherwise known as paper trading. Using a simulated account, traders can trade their strategy without risking any real money. This will help ensure that your strategy continues to work in current market conditions, and provides important practise.
Review your performance consistently, either via your trading platform or by creating a trading journal.
Limitations of Price Action
Sometimes trading price action may not be so black and white. Traders will draw different conclusions from the same information in some cases. Furthermore, some market data may be alluding to a given direction, while another contradicts.
Trading on price movement alone is not a perfect method (nor is any trading method). This is why it is important to provide as much confirmation as possible. This is done by using tools such as indicators, and larger time frames. The more confirmation that you have on a trade the stronger its signal. A trade with a varied set of signals confirming one and other will be a high-probability trade.
It’s important to remember that even the best trading set ups can fail. Trading price action may provide an indication of a more probable outcome, but never a definite outcome. Because of this it’s important to balance your risk to reward and stick to your trading plan.
Learning a Price Action Strategy
There are a lot of resources available should you want to learn a strategy. There are free options for learning, as well as paid, but there is no ‘one size fits all’ solution.
Whichever method you choose, be sure to question the validity and quality of the source. Find resources from educators or traders who have a proven strategy. You should also consider getting your information from only a few sources to ensure everything is congruent.
Learning any form of trading from a variety of sources can lead to inconsistent trading. Your strategy needs to be clear and defined. One of the benefits of learning to trade with a qualified educator is that all of the content remains consistent. You end up learning a core strategy and look to become proficient at trading it.
If you’re learning how to trade through an academy within Australia, make sure they operate under an AFSL or CAR license. Start things slowly, consider a stock trading course for beginners then practise on a simulated account. Don’t jump straight into trading real money, wait until you have proven yourself in simulation first.
Trading Price Action: Bottom Line
We’ve now delved into the heart of price action trading, dissecting its key principles and techniques. From recognising candlestick patterns to support and resistance levels, we’ve unveiled the art of interpreting price movements to make informed trading decisions.
This form of trading encourages us to tap into the collective psychology of the market participants. A trader can understand fears, hopes, and sentiments as they unfold on the price charts. It’s about gaining an intuitive understanding of the market’s rhythm.
It’s vital to remember that mastering price action trading is no quick fix. It demands dedication, practice, and a willingness to learn from both successes and failures. It’s about developing the trader’s mindset, which combines discipline, patience, and adaptability.
Trading pure price movement is a versatile approach that can be applied to various asset classes and timeframes. This makes it accessible to traders with diverse preferences. Whether you’re a day trader or a long-term investor looking for strategic entries, the principles remain relevant.
So, as you embark on your journey into the world of trading, remember that it’s not merely a strategy. Trading is about a profound understanding of market dynamics, and a disciplined approach to risk management.
If you’d like to learn more about price action trading, or day trading, you should check out our free trading class.


