What is Price Action Trading?
So, what is price action trading exactly? Price action trading refers to the movement of a security’s price over time. It’s a method of predicting future price movements based on the historical price data.
A price action trader uses only information involving price history to make trading decisions.
By studying these trading patterns, traders can identify trends, support and resistance levels, and potential entry and exit points. Price action trading is favoured by many traders because it eliminates the need for complex indicators or other external factors. Solely trading price action allows traders to focus only.
Trading price action is all about understanding the language of the market. As a trader, you must learn to decipher the messages that price movements convey.
Key Principles of Price Action
If you’re just stepping into the world of price action, it’s helpful to know that technical analysis is built on a handful of core principles. Let’s break down the essentials:
- The Market Reflects Everything: Every bit of available information—news headlines, earnings results, economic data, even rumors—is baked into current prices. There’s no need for a crystal ball; just observing the price can tell you a great deal about the market’s collective mindset.
- Trends Are Your Friend: Prices don’t typically move in a completely random fashion. Instead, they often follow trends—upwards, downwards, or sideways. Spotting these trends early and riding them is a fundamental skill for any price action trader.
- History Offers Clues: While the market never repeats itself in exactly the same way, historical price movements often echo in the present. Patterns you see on the charts today can be similar to ones from the past, offering hints about what might happen next.
Let’s put these principles into context. Suppose you notice a major stock like Tesla suddenly dropping by double digits. Rather than rushing to dig through news releases or earnings reports, a technical analyst zeroes in on the actual price movements and patterns unfolding on the chart. Their focus is on the behavior of the crowd as shown in the price—a belief that the “story” is told most honestly in real time, right there in the chart.
Trading Price Action
Price action trading requires patience, discipline, and a deep understanding of market dynamics. It can be an effective way to interpret market sentiment and make informed trading decisions based on pure price movement.
In the world of trading, price action is like a language that communicates the sentiments and movements of the market. It allows traders to navigate through the complex world of finance with simplicity and precision.
A price action strategy should include a method to find high-probability trades, but also to manage risk. Part of a price action strategy is to use tools such as stop loss orders to manage risk.
Choosing the Right Time Frame for Your Trading Style
Selecting the ideal time frame is essential when building your price action trading approach. The “best” chart to use really comes down to the trading style you prefer—each style aligns with its own time horizon.
-
Scalping: If you thrive on fast-paced action and quick decisions, scalp trading might suit you best. Scalpers typically analyze the market on ultra-short time frames, such as 1-minute or 5-minute charts. This allows them to spot small price fluctuations and capitalize on rapid moves.
-
Day Trading: For those looking to close positions by the end of each session, day trading is a fitting choice. Day traders tend to focus on slightly longer time frames, like the 15-minute, 30-minute, or 1-hour charts. These windows help you catch intraday trends and avoid holding positions overnight, reducing unexpected risks from after-hours news.
-
Swing Trading: If your strategy involves holding trades for several days to a few weeks in pursuit of larger swings, swing trading may be your style. Traders here look to the 4-hour and daily charts, using the broader perspective to spot emerging trends without the noise of the lower time frames.
-
Position Trading: Prefer a long-term approach? Position traders keep their gaze fixed on the daily, weekly, or even monthly charts. This approach smooths out the day-to-day volatility and focuses on bigger-picture trends, perfect for those willing to let trades develop over weeks or months.
Ultimately, aligning your chosen time frame with your trading personality and goals is essential. By matching your analysis window to your strategy, you set yourself up for clearer signals—and less stress—when interpreting the market’s story.
Strategies For Price Action Trading
There are several methods that traders use to trade price action.
Here are some of methods of price action analysis:
Support and Resistance
One common method used in price action trading is identifying key support and resistance levels on a price chart.
Support levels are areas where the price has historically found strong buying interest, causing it to bounce back up.
Resistance levels, on the other hand, are areas where selling pressure has historically been strong, causing the price to reverse its upward movement. Traders can use these levels as potential entry or exit points for their trades.
Support and resistance act as fundamental markers of supply and demand. When price approaches a support level, it often halts or even reverses because buyers tend to step in, creating a “floor” beneath the price. For example, if the value of bitcoin repeatedly bounces off $80,000, this price represents a significant concentration of demand—buyers consistently emerge at this level to defend it.
Conversely, resistance levels indicate where selling supply increases. If a stock, such as Apple, struggles to break above a certain price multiple times—say, $230—it suggests a concentration of sellers willing to part with their shares at that price, effectively creating a “ceiling” for the price.
Support and resistance can be formed via gaps in price, candlesticks, patterns, and even psychological numbers. Support and resistance levels can be considered as the backbone of all price action trading.
Trend Trading
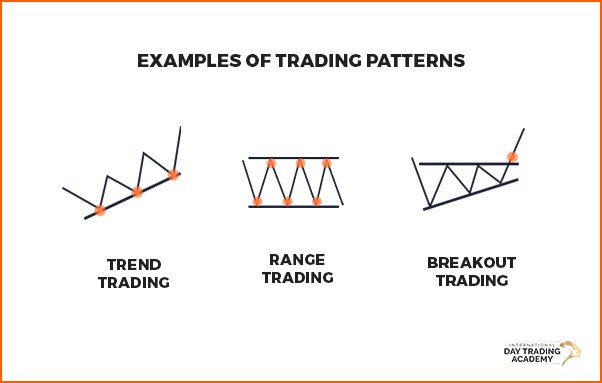
Trend trading is another popular method used in price action trading. Traders who follow this approach try to identify and trade along with the dominant trend in the market.
By analysing the highs and lows of price movements, traders can determine whether the market is trending upwards, downwards, or moving sideways.
In trend trading, traders aim to enter a trade when the market is in an established trend and exit when there are signs of a reversal. This method allows traders to capture larger price movements and potentially maximize their profits.
An uptrend is identified by higher highs and higher lows. This means that the market is clearly moving in an upward direction. A downtrend is defined as a prolonged string of lower highs and lower lows.
Breakouts
There are 2 important levels in trading, support and resistance.
A breakout occurs when price breaks above resistance, or below support. If price breaks above resistance a trader might look to take a long position. Should price break below support, a trader would consider this as a potential selling opportunity.
A breakout of either of these levels suggests that a trend could be forming, either up or down. If price breaks resistance, it may trend up, if support is broken there may be a downtrend.
Breakouts can often be accompanied by higher volume this is considered to be a momentum trade. This happens when a great number of market participants identify the breakout and seek to profit from it.
The Role of Volume in Breakouts
Volume is a key indicator for confirming the strength of a breakout. When the price breaks through support or resistance on high volume, it signals strong conviction behind the move—think of it as a crowd rushing through an open door, not just a few people wandering by. High volume on a breakout suggests that the price action is likely genuine and may lead to a sustained trend.
On the other hand, if a breakout occurs on low volume, it’s a bit like hearing applause in an empty theater—the move might not have staying power. Light volume often means not many traders are participating, and the price could quickly return to its previous range.
Quick tip: Major spikes in volume can often mark critical turning points in the market, attracting even more attention from traders.
For example, if a stock jumps significantly in price and millions of shares change hands, that’s a strong sign that the move is backed by real buying interest. If the same price movement happens with very little volume, traders might view it as a potential “blip” rather than the start of a new trend.
Understanding the relationship between price and volume helps traders distinguish between genuine breakouts and those that are more likely to fizzle out.
Not all breakouts continue on to form a resulting trend. There is a term for trades that breakout but fail reasonably quickly, which is a ‘fakeout‘. This can sometimes result in a complete reversal of direction in price.
Reversals
Simply put, a reversal in trading is the change in the direction of price movement. Reversals occur after an overall trend in the market meets some form of resistance and then moves in the opposite direction. A reversal from an uptrend would reverse into a downtrend, a reversal of a downtrend would reverse upward.
Reversals are popular with swing traders who want to take advantage of larger movements. A swing trader would look to use a reversal as a way of capturing a newly forming trend and hold that position.
It is only considered a reversal if the direction of the trend changes. Price moves off support and resistance levels frequently, a reversal is a more meaningful change in direction.
A less meaningful change in price direction is considered a ‘pullback’ which can look a lot like the beginnings of a reversal. The difference is that a pullback is a form of consolidation that will result in price then continuing the current overall trend.
Consolidation Zones and Supply & Demand
Consolidation zones occur when price moves sideways within a range, reflecting a temporary balance between buyers and sellers. These zones are often seen as periods where supply and demand are in equilibrium, and neither side has enough strength to push the price decisively in one direction. Traders will often mark these areas—sometimes with rectangles—because they indicate where significant buying or selling interest has emerged in the past. When price eventually breaks out of a consolidation zone, it signals that one side (buyers or sellers) has gained control, and a new move may be underway.
Supply and demand zones are broader areas of interest that tend to attract market activity, especially during pullbacks. Price often reacts to these zones on subsequent visits, providing traders with additional clues about where reversals or continuations may occur.
Other factors, such as order flow, price gaps, candlestick patterns, and retests of key levels, can also provide insight into the ongoing battle between buyers and sellers during these consolidation periods.
Rising Wedge Patterns and Trend Reversals
A rising wedge pattern is one of the classic price action signals that traders watch for signs of a possible trend reversal, particularly when it shows up in an uptrend. This pattern forms when price creates higher highs and higher lows—but the highs are rising at a slower pace than the lows, converging into an increasingly narrow channel.
Here’s how it tends to play out:
- The gradually narrowing price action signals that buying momentum is weakening, even though prices might still be climbing.
- If price then breaks down below the wedge’s lower trend line, it often indicates that the selling pressure has overtaken buyers, suggesting a potential reversal from an uptrend to a downtrend.
- To confirm the pattern, traders often look for a spike in volume on the breakdown, which suggests that more market participants are acting on the shift.
- Additional chart signals—like a bearish engulfing candlestick or a double top forming near the wedge’s peak—can add further confidence that the trend is turning.
By setting appropriate stop-loss levels just above the wedge and targeting key price support below, traders can manage risk as they look to capture the new direction triggered by the reversal.
Candlesticks Analysis
Candlestick analysis is a highly effective method for trading price movement. This approach involves studying the patterns and formations created by candlestick charts to identify potential market reversals or continuations.
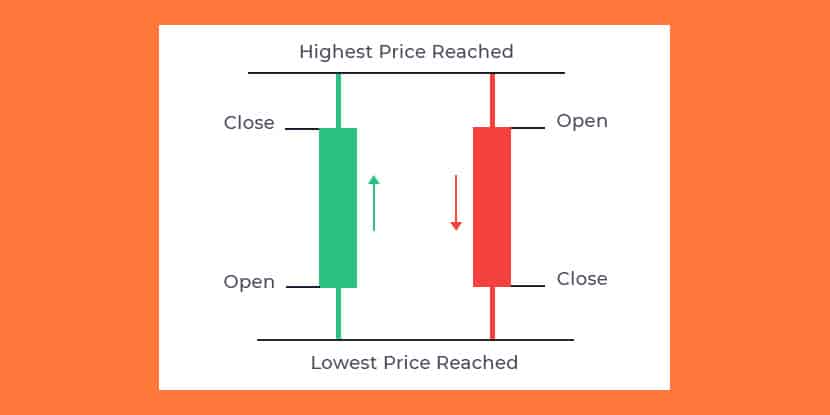
Each candlestick represents a specific time period and displays the opening, closing, high, and low prices during that period. Traders analyse the shape, size, and position of these candlesticks to gain insights into market sentiment and potential price movements.
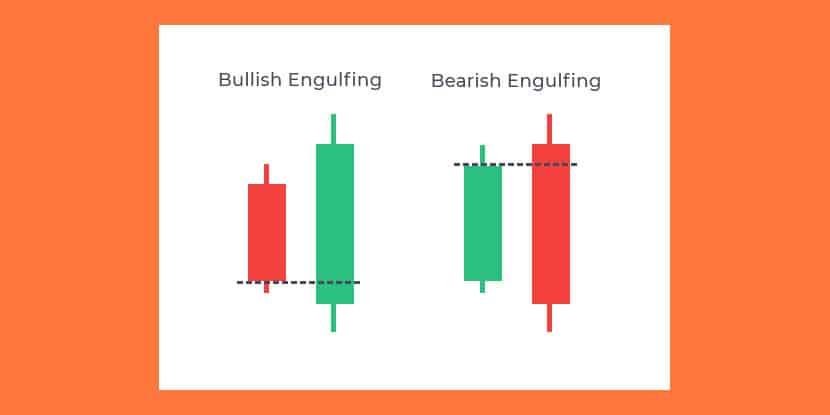
For example, a bullish engulfing pattern, where a small bearish candle is followed by a larger bullish candle that engulfs it, indicates a potential trend reversal from bearish to bullish.
On the other hand, a bearish engulfing pattern signals a potential reversal from bullish to bearish. Traders also pay attention to doji patterns, hammer patterns, and shooting star patterns, among others, for further confirmation of market sentiment.
Knowing how to read candlestick charts is a powerful skill for any trader to possess.
Price Action Patterns
Trading patterns are another important aspect of price action trading. These patterns are formed by the repeated behaviour of market participants and can provide valuable insights into future price movements. Trading these types of patterns is one many popular forms of technical analysis.
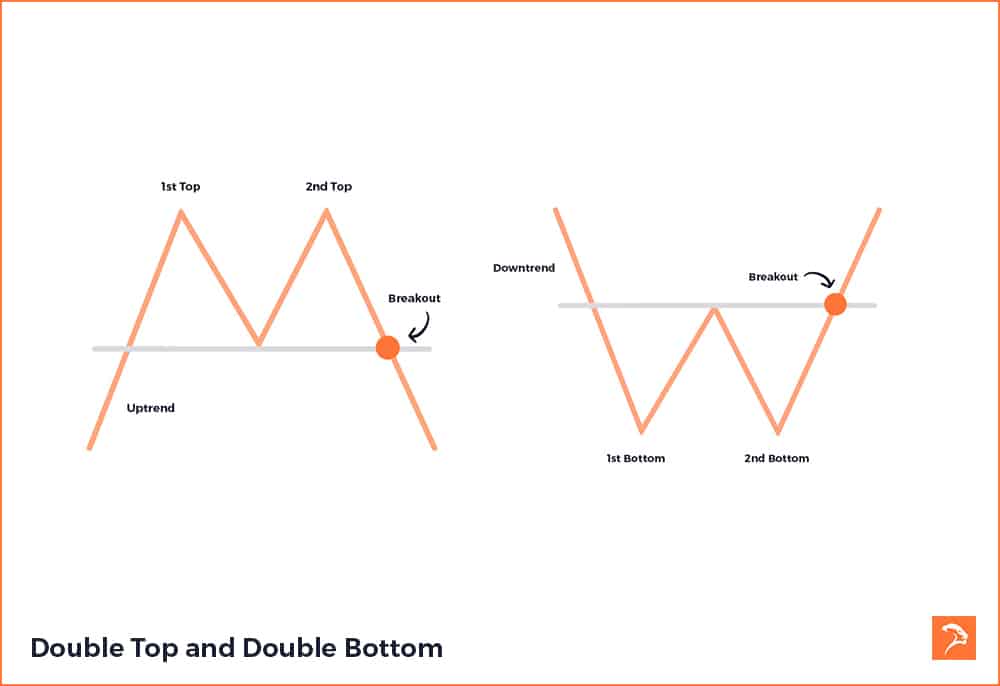
One common trading pattern is the double top or double bottom pattern. This occurs when price reaches a certain level, pulls back, and then returns to that level again before reversing. Traders often interpret this as a sign that the previous trend is losing strength and a reversal may be imminent. Think of the second top or bottom as confirmation that there may be an area of support or resistance.
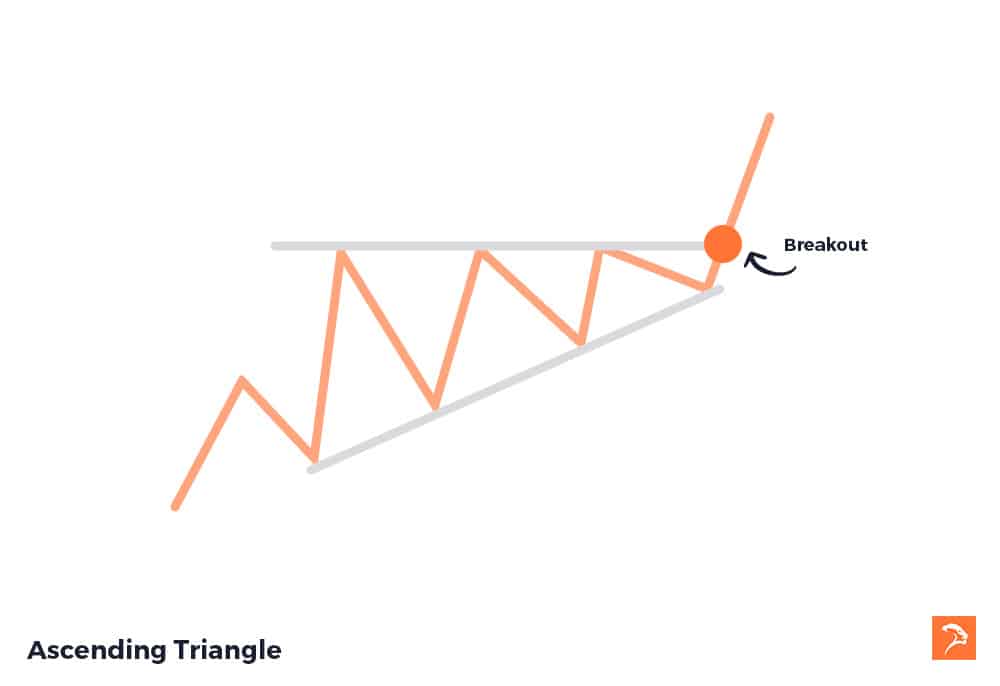
Another popular pattern is the ascending triangle pattern. An ascending triangle pattern is used to identify breakouts, or a breaking resistance. This pattern forms after trend upward breaks above a key resistance level. With the resistance level broken, price is no longer tethered and can potentially run to the next level of resistance.
Pattern Recognition Tools
In recent years, advances in chart pattern recognition have made price action trading more accessible. Many traders now use software that automatically scans charts to identify common trading patterns, acting as a high-tech assistant that keeps an eye on countless markets simultaneously. These tools can help spot potentially profitable setups that might otherwise go unnoticed.
Some common types of pattern recognition tools include:
- Scanner software: Programs that screen a wide range of markets for specific chart patterns.
- Automated charting features: Many platforms now highlight potential patterns right as they are forming.
- AI-based recognition: Machine learning systems that continuously improve their ability to identify subtle price action setups.
- Alert systems: Notifications that let traders know instantly when a watched pattern appears.
Fast Fact:
While modern tools can help identify opportunities, price action trading still demands strict discipline—especially in risk management. The ease of execution today only makes it more important to stay focused on your plan and avoid overtrading.
Reversal Patterns
Reversal patterns help traders spot potential turning points where the prevailing trend may be ending and a new trend is about to begin. One common trading pattern is the double top or double bottom pattern. This occurs when price reaches a certain level, pulls back, and then returns to that level again before reversing. Traders often interpret this as a sign that the previous trend is losing strength and a reversal may be imminent. Think of the second top or bottom as confirmation that there may be an area of support or resistance.
Other well-known reversal patterns include head and shoulders, engulfing patterns, morning and evening stars, and wedges. Price action traders use these patterns to determine shifts in market sentiment, watching for confirmation signals such as breaks in trend lines or significant increases in trading volume. Since not every pattern will play out as expected, experienced traders often use stop-loss orders to manage risk when trading reversal patterns.
Continuation Patterns
Continuation patterns, on the other hand, identify periods of consolidation before the prevailing trend resumes. One popular pattern is the ascending triangle pattern. An ascending triangle pattern is used to identify breakouts, or a breaking resistance. This pattern forms after trend upward breaks above a key resistance level. With the resistance level broken, price is no longer tethered and can potentially run to the next level of resistance.
By recognising both reversal and continuation patterns, traders are better equipped to anticipate market moves and manage their trades effectively. These patterns, when combined with other elements of price action analysis, offer a robust framework for understanding and navigating the markets.
Another popular trading chart pattern is the ascending triangle pattern. An ascending triangle pattern is used to identify breakouts, or a breaking resistance. This pattern forms after trend upward breaks above a key resistance level. With the resistance level broken, price is no longer tethered and can potentially run to the next level of resistance.
Continuation Patterns
Continuation patterns are another key area traders watch for in price action. These patterns suggest that, after a brief pause or consolidation, the market is likely to continue moving in its existing direction rather than reverse.
Some of the most common continuation patterns include:
-
Flags: These resemble small rectangles that slope against the prevailing trend, often following a sharp price movement. The flag represents a quick consolidation before the trend typically resumes its original direction.
-
Pennants: Pennant patterns form when price consolidates between converging trend lines, creating a small symmetrical triangle after a strong price move. Pennants usually signal a continuation once the pattern completes.
-
Triangles: Ascending, descending, and symmetrical triangles are all common. Triangles reflect periods of tighter price action and indecision, but typically resolve in the direction of the preceding trend.
Recognising these continuation patterns can help traders time entries and manage risk during trend moves, as they signal likely trend persistence following their completion.
Helpful Tools
Although trading price action doesn’t strictly require additional tools, they can be useful. Trading platforms all have built in features that can assist traders in identifying market sentiment, or marking up the above-mentioned methods. Some of the most commonly used tools are indicators, and drawing tools.
Technical Indicators
Trading price action doesn’t strictly involve the use of trading indicators, but they can be a valuable addition. Neither patterns, nor indicators are perfect, and sometimes one adds missing context. Indicators are a trading platforms tool for visualising complex data. This can include current volume, relative strength, moving averages, and more.
It’s a good idea to add a few trading indicators to your charts as a way of ‘confirming’ any movements that you’ve identified using your price action strategy.
Using Drawing Tools in Your Price Action Strategy
Any decent trading platform provides various drawing tools to mark-up price movement on your charts. These tools can be used to visualise things like support and resistance, trendlines, and to draw patterns.
While seasoned traders can identify these forms of pure price movement, using drawing tools is useful for beginners.
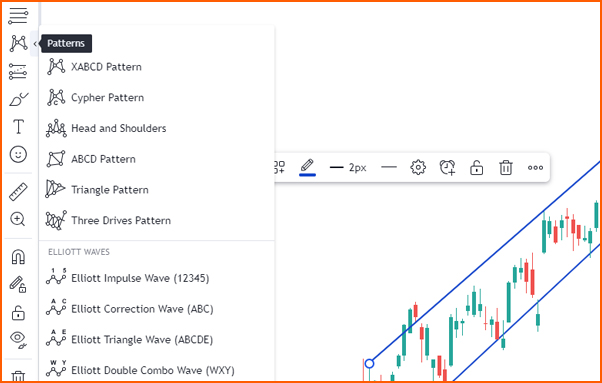
Example of price action drawing tools in tradingview
How to Backtest Price Action Strategies
It’s important to backtest price action trading strategies to validate performance. You shouldn’t employ a trading strategy without having tested whether it works.
Using your trading platform, review historical data and apply the strategy. Most trading platforms offer market replay functions, for this. This will allow you to trade without risking capital. Continue this process until your sample size is large enough to prove effectiveness.
It’s also important to forward test your trading strategy. Again, most trading platforms provide simulated trading, otherwise known as paper trading. Using a simulated account, traders can trade their strategy without risking any real money. This will help ensure that your strategy continues to work in current market conditions, and provides important practise.
Review your performance consistently, either via your trading platform or by creating a trading journal.
Limitations of Price Action
Sometimes trading price action may not be so black and white. Traders will draw different conclusions from the same information in some cases. Furthermore, some market data may be alluding to a given direction, while another contradicts.
Trading on price movement alone is not a perfect method (nor is any trading method). This is why it is important to provide as much confirmation as possible. This is done by using tools such as indicators, and larger time frames. The more confirmation that you have on a trade the stronger its signal. A trade with a varied set of signals confirming one and other will be a high-probability trade.
It’s important to remember that even the best trading set ups can fail. Trading price action may provide an indication of a more probable outcome, but never a definite outcome. Because of this it’s important to balance your risk to reward and stick to your trading plan.
Learn Price Action Trading
There are a lot of resources available should you want to learn price action trading. There are free options for learning, as well as paid, but there is no ‘one size fits all’ solution.
Whichever method you choose, be sure to question the validity and quality of the source. Find resources from educators or traders who have a proven strategy. You should also consider getting your information from only a few sources to ensure everything is congruent.
Learning any form of trading from a variety of sources can lead to inconsistent trading. Your price action trading strategy needs to be clear and defined. One of the benefits of learning to trade with a qualified educator is that all of the content remains consistent. You end up learning a core strategy and look to become proficient at trading it.
If you’re learning how to trade through an academy within Australia, make sure they operate under an AFSL or CAR license. Start things slowly, consider a stock trading course for beginners then practise on a simulated account. Don’t jump straight into trading real money, wait until you have proven yourself in simulation first.
Trading Price Action: Bottom Line
We’ve now delved into the heart of price action trading, dissecting its key principles and techniques. From recognising candlestick patterns to support and resistance levels, we’ve unveiled the art of interpreting price movements to make informed trading decisions.
This form of trading encourages us to tap into the collective psychology of the market participants. A trader can understand fears, hopes, and sentiments as they unfold on the price charts. It’s about gaining an intuitive understanding of the market’s rhythm.
It’s vital to remember that mastering price action trading is no quick fix. It demands dedication, practice, and a willingness to learn from both successes and failures. It’s about developing the trader’s mindset, which combines discipline, patience, and adaptability.
Trading pure price movement is a versatile approach that can be applied to various asset classes and timeframes. This makes it accessible to traders with diverse preferences. Whether you’re a day trader or a long-term investor looking for strategic entries, the principles remain relevant.
So, as you embark on your journey into the world of trading, remember that it’s not merely a strategy. Trading is about a profound understanding of market dynamics, and a disciplined approach to risk management.
If you’d like to learn more about price action trading, or how to start trading, you should check out our free trading class.

Cameron has over 10 years experience in teaching people how to day trade the futures markets. He has feature alongside the CME Group, and NinjaTrader, and has been published in multiple magazines, including leading trading magazine Your Trading Edge magazine.


